The Nicest Place in America Animations
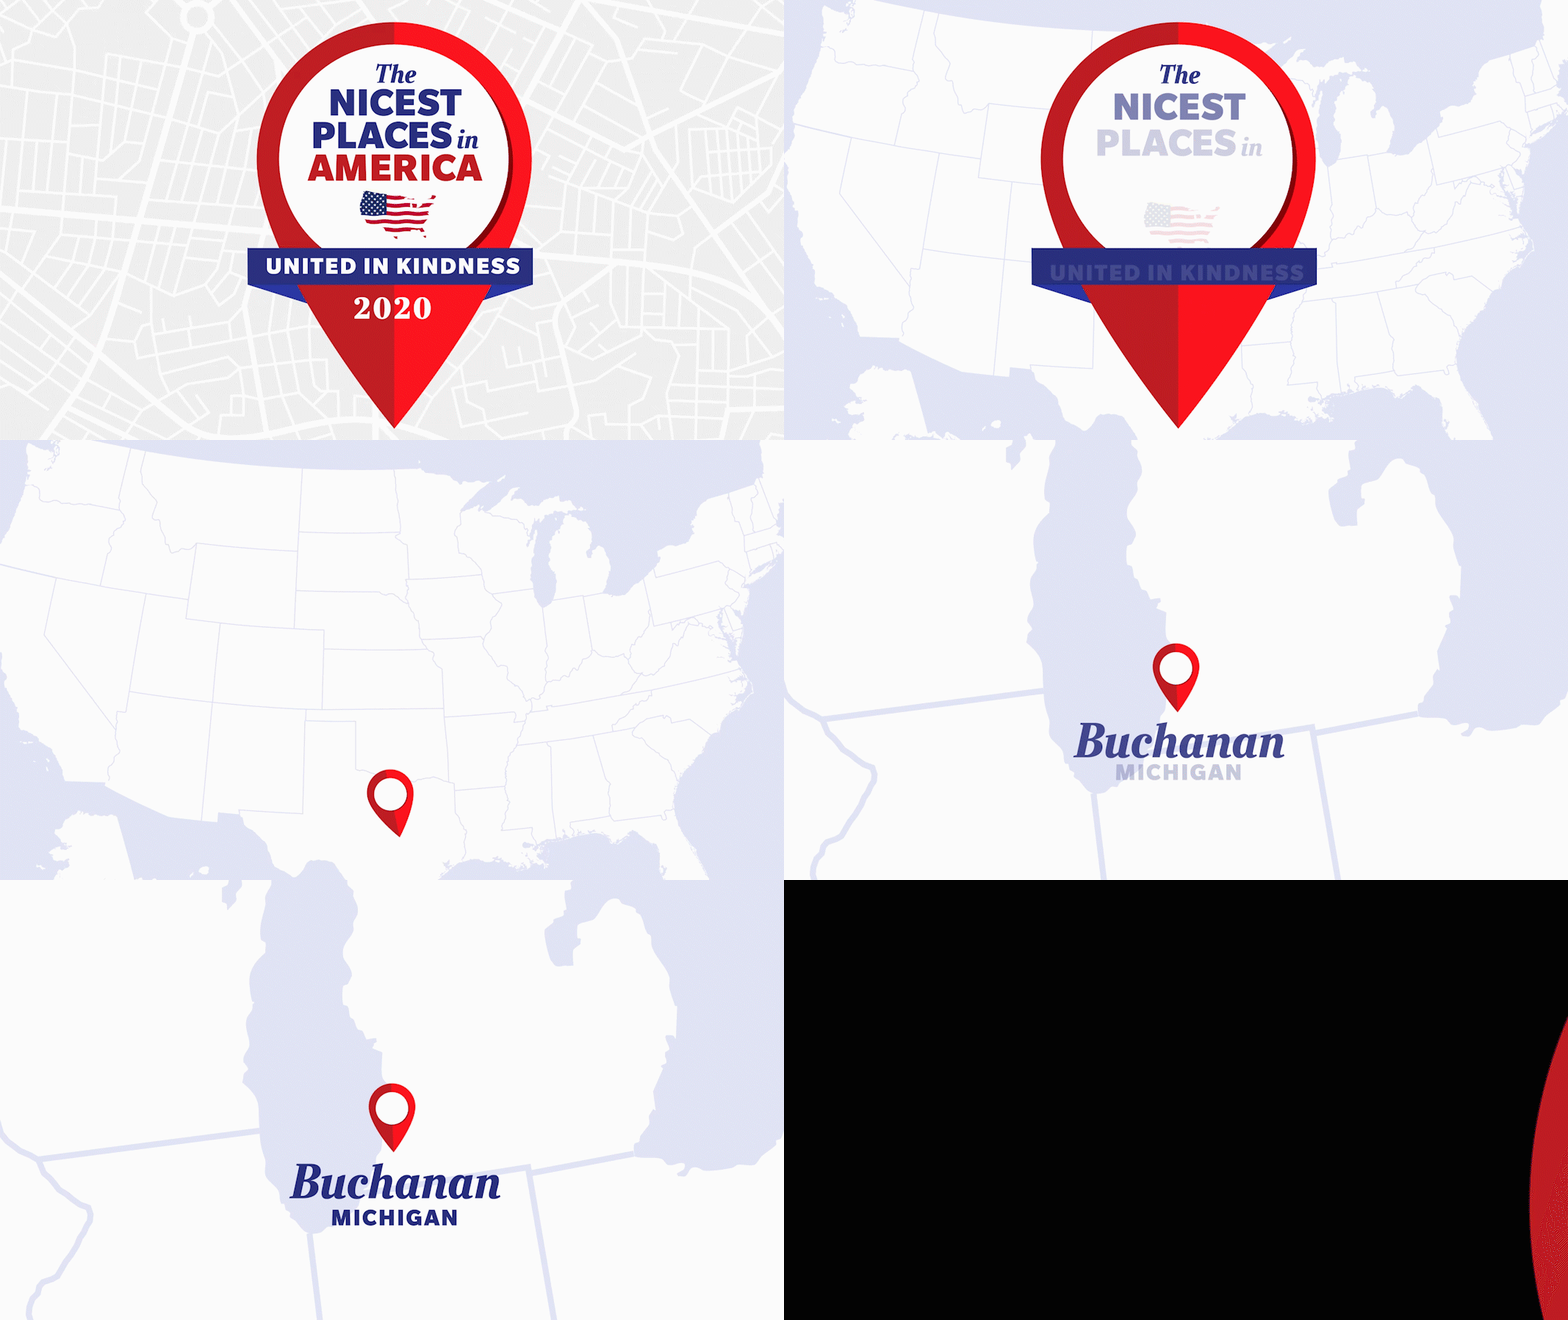
Every year, Reader's Digest names one town in America as The Nicest Place. For the 2020 video reveal, I created an animated introduction and conclusion. The first video highlights a couple buildings that made 2020 the year that it was: a hospital to represent public health; a government building to represent the political turmoil.


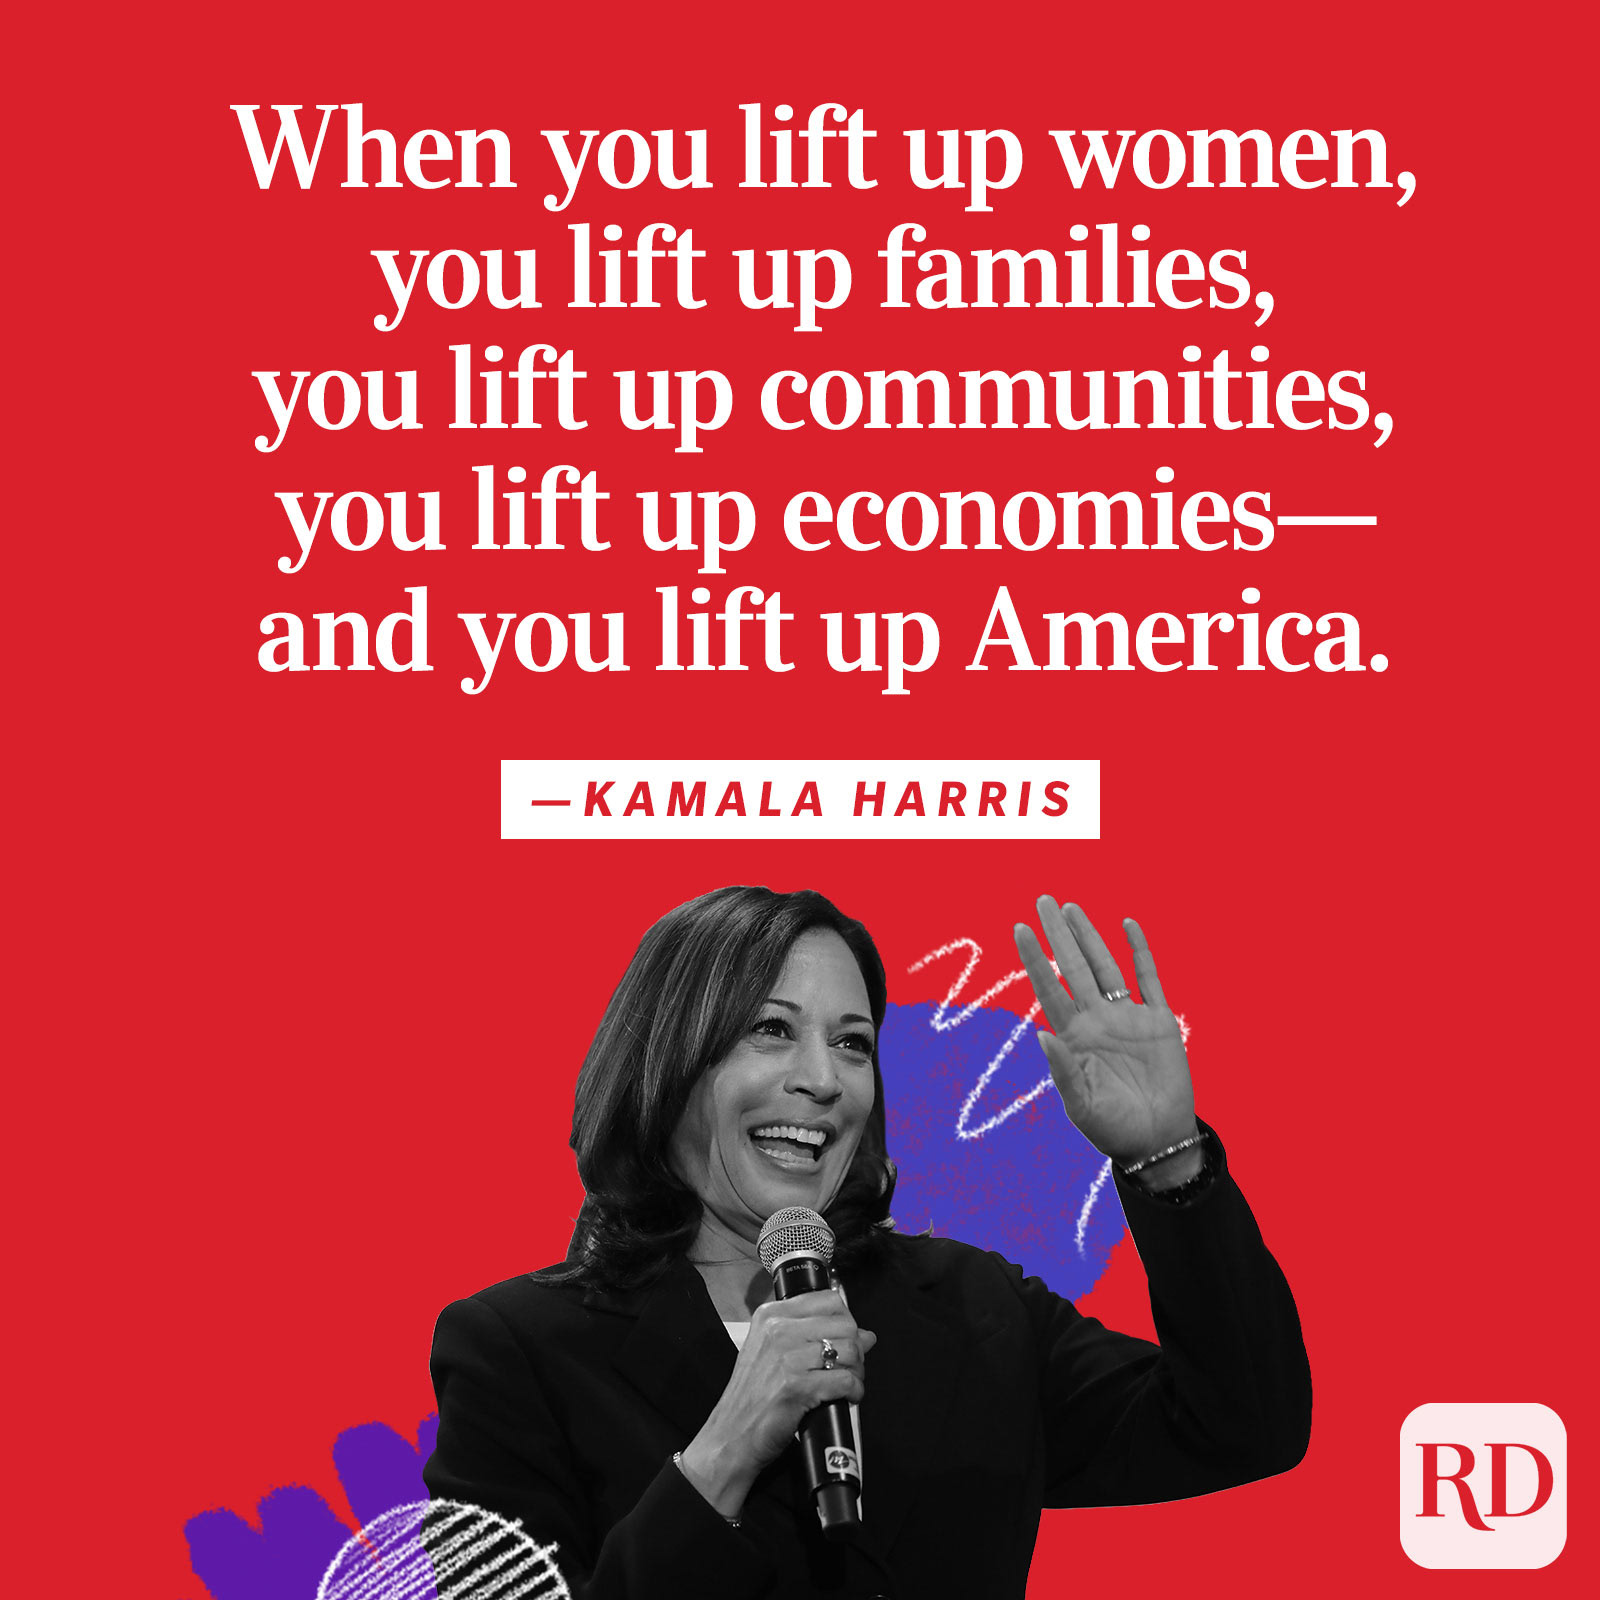
Digital Photo Collages
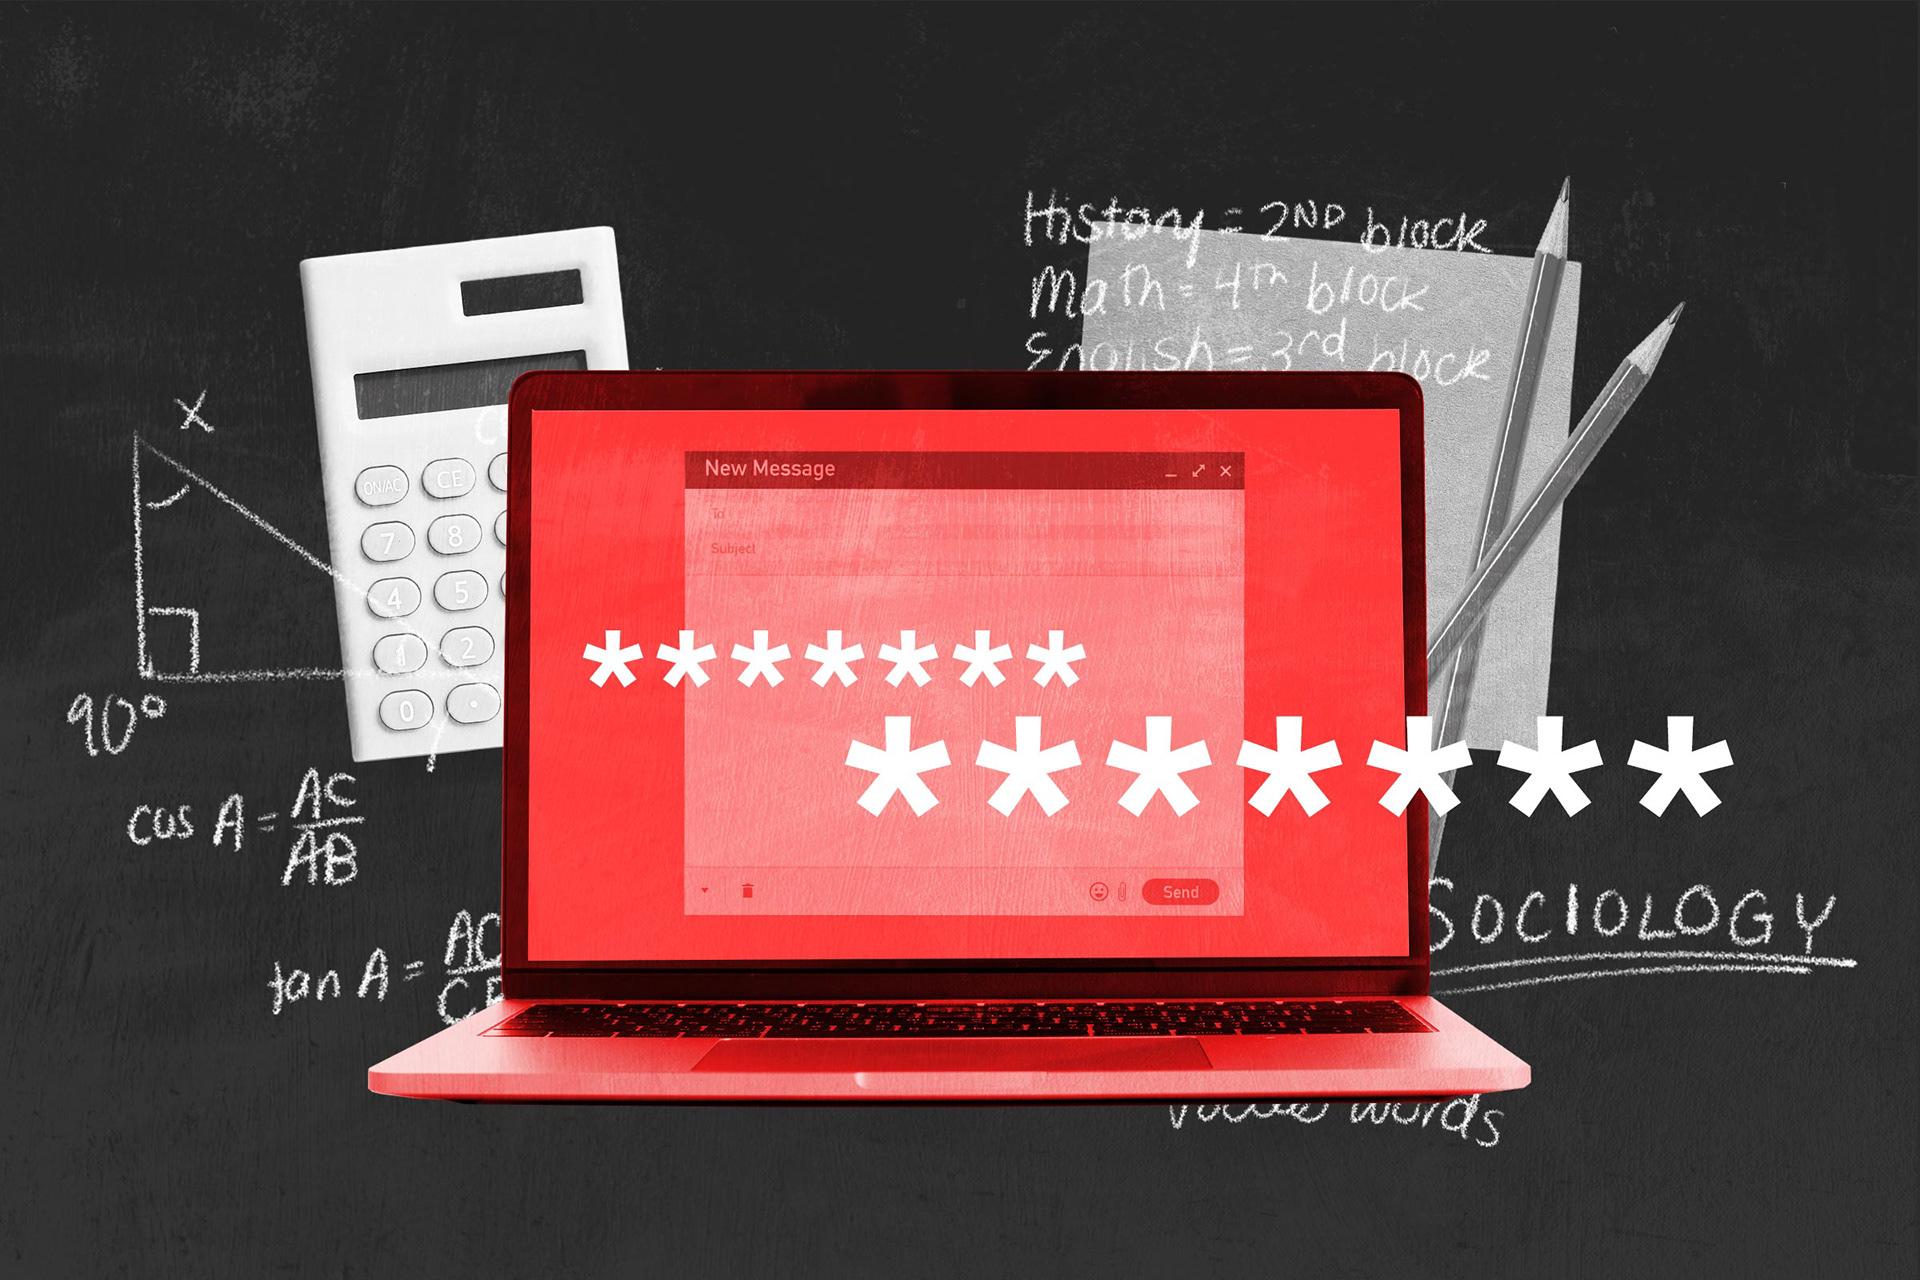
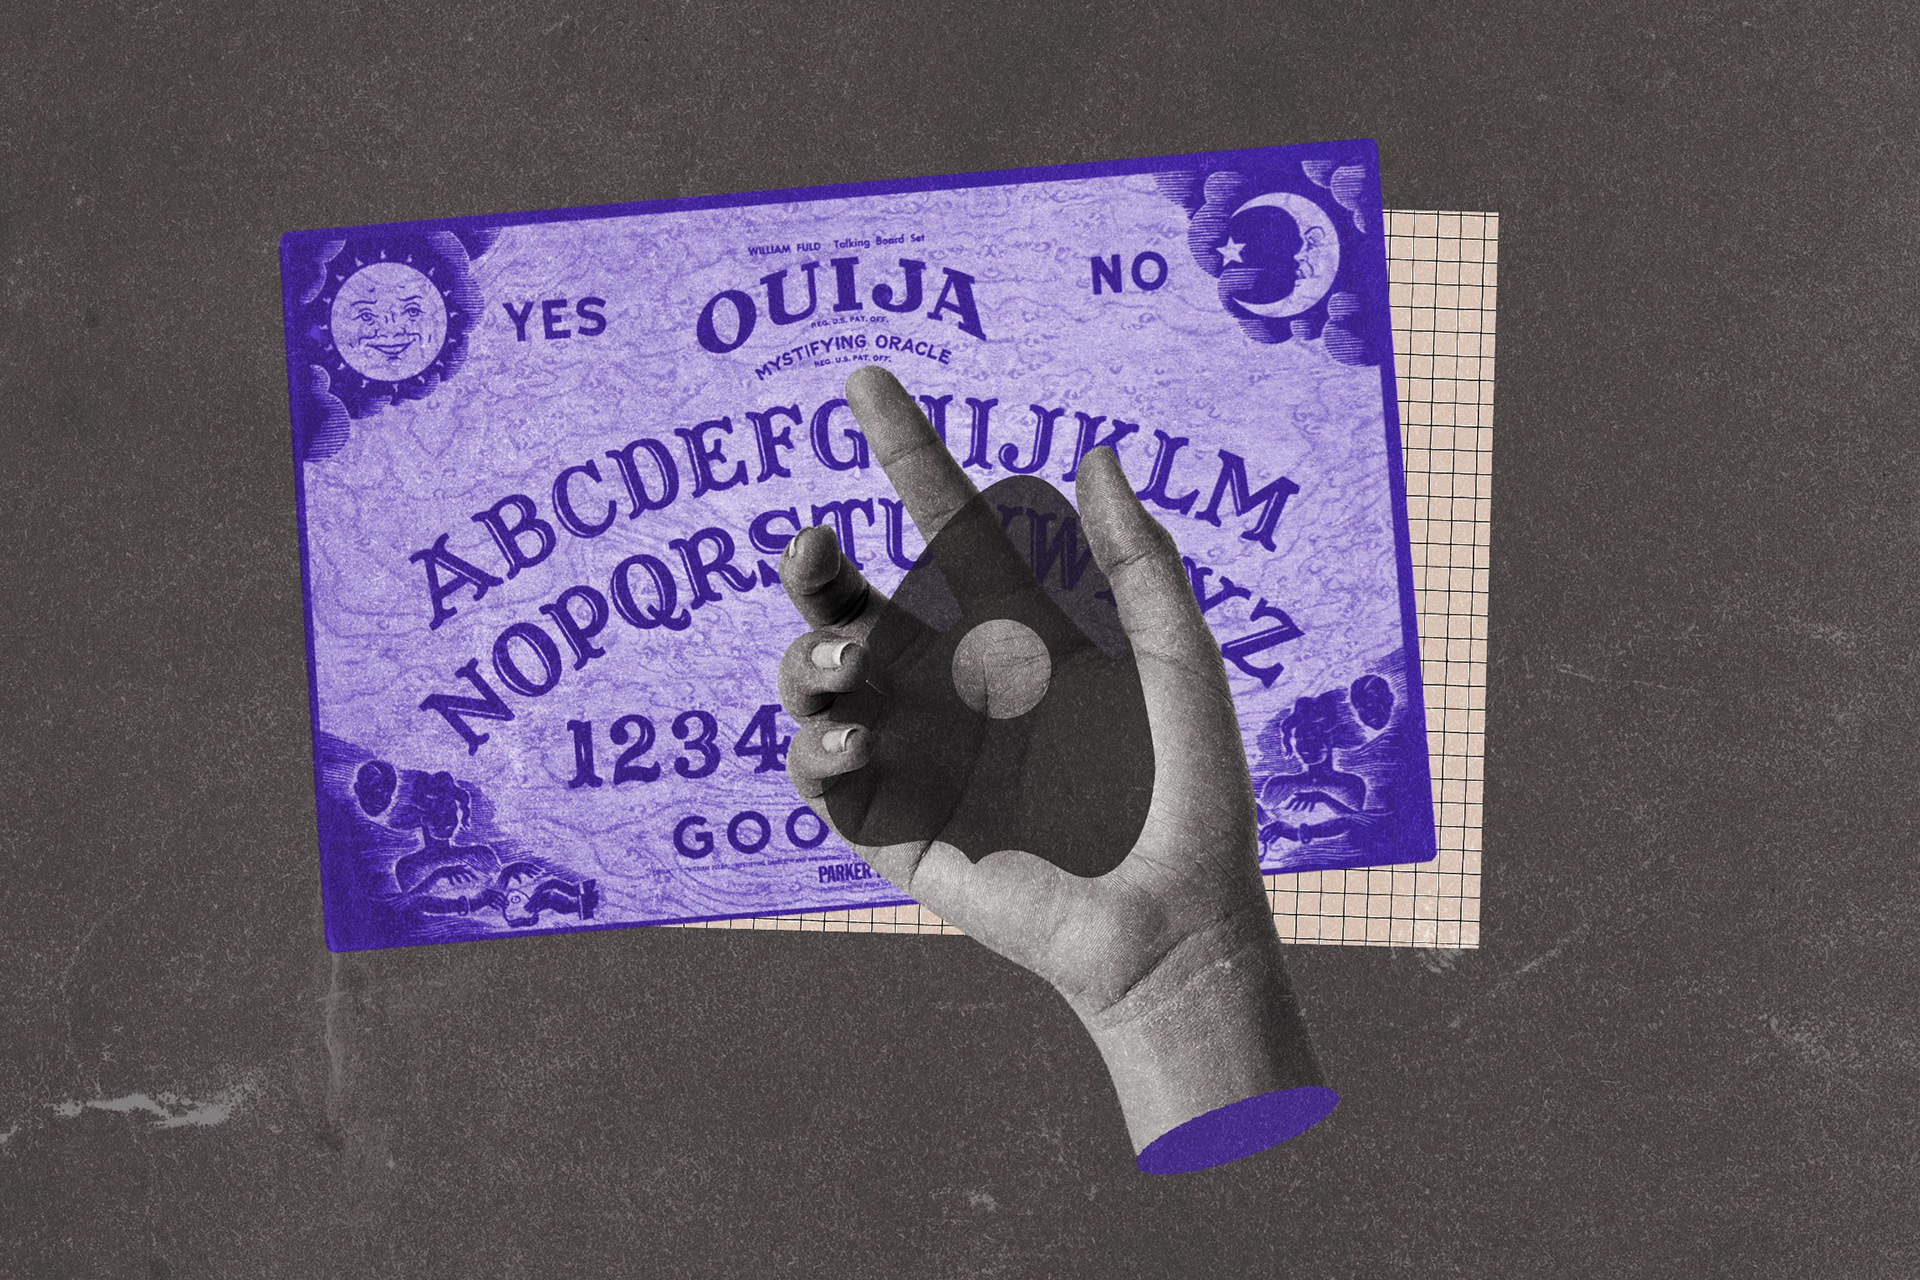
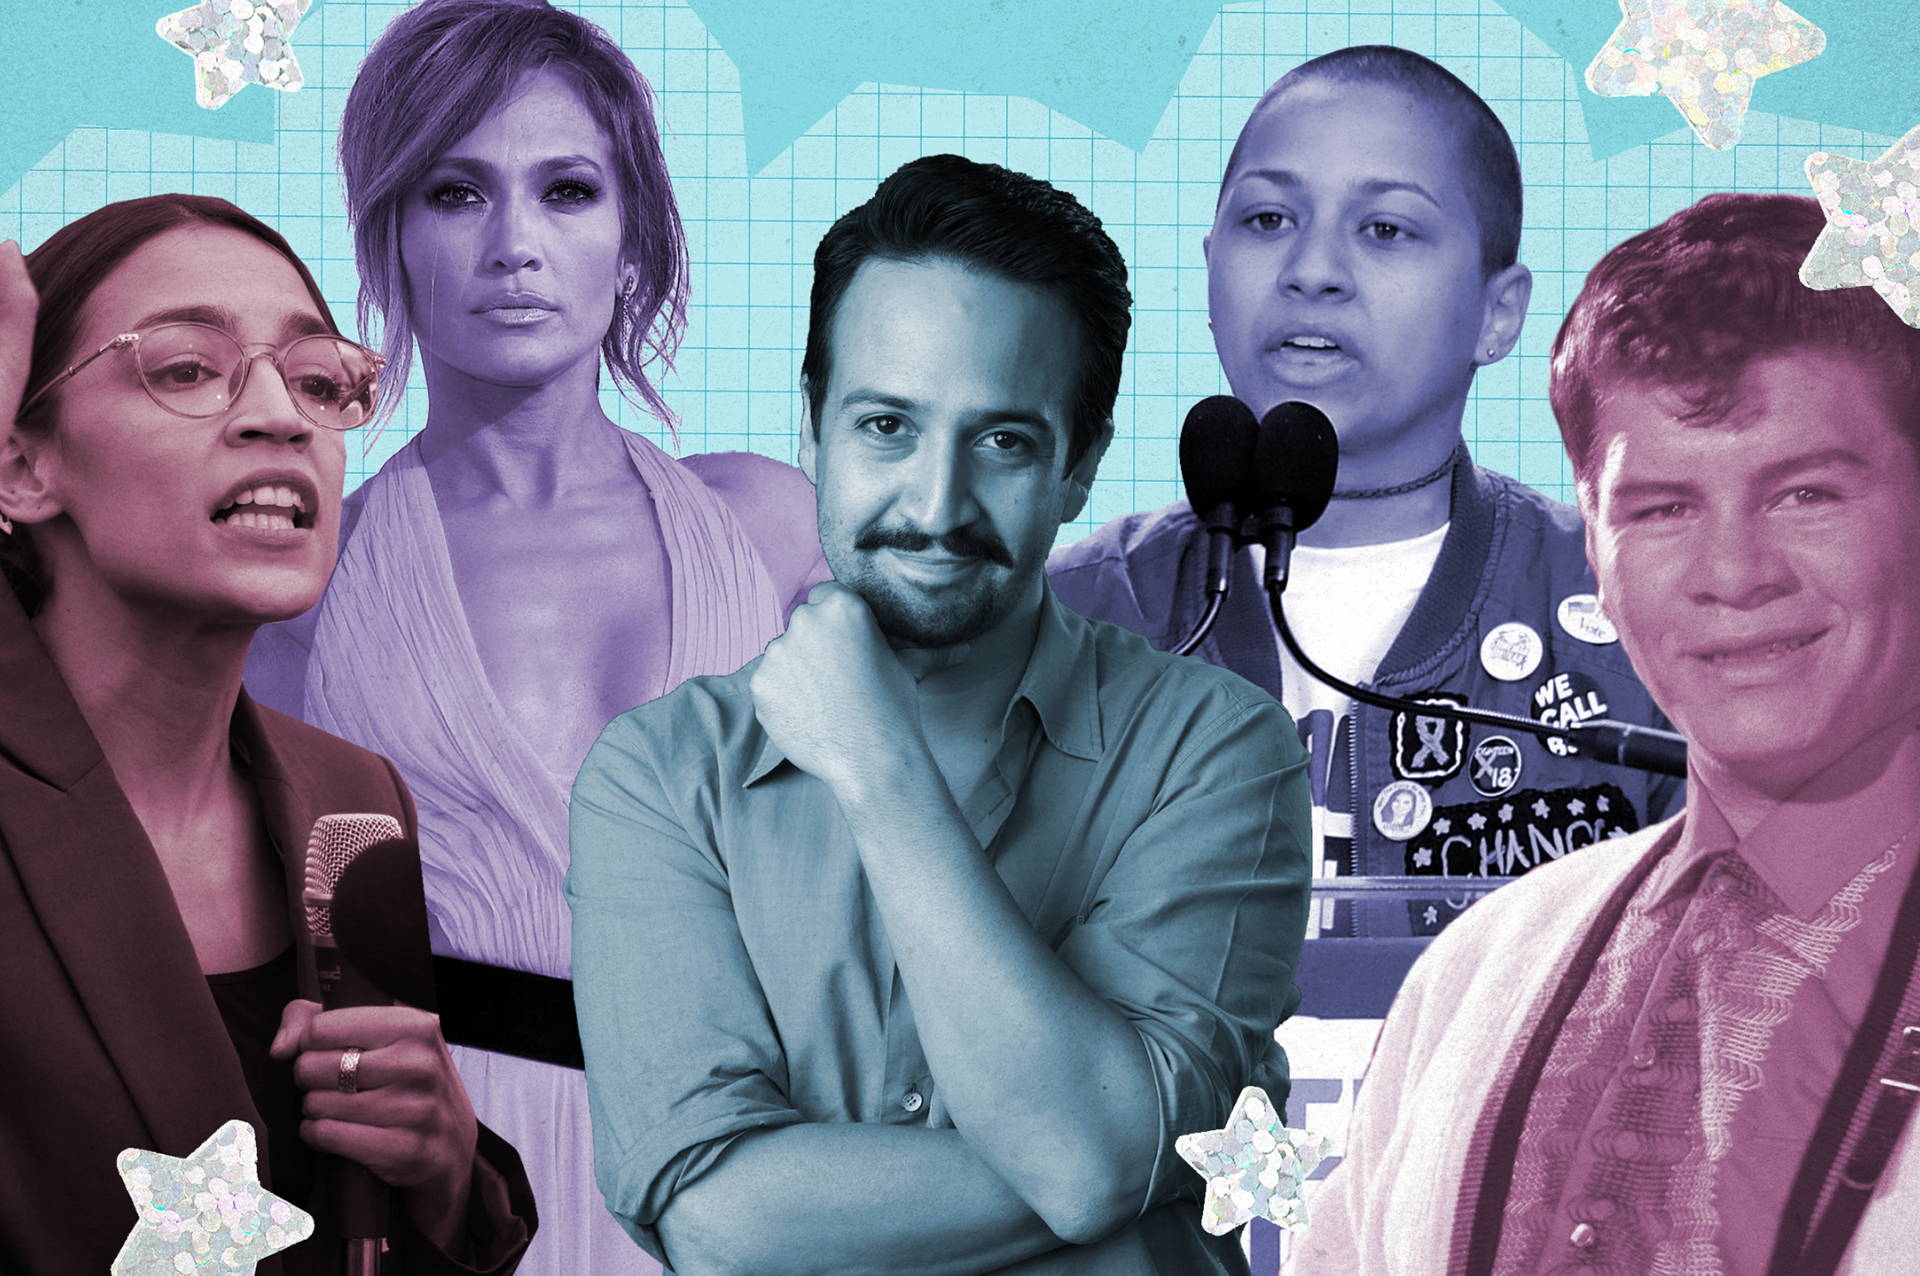
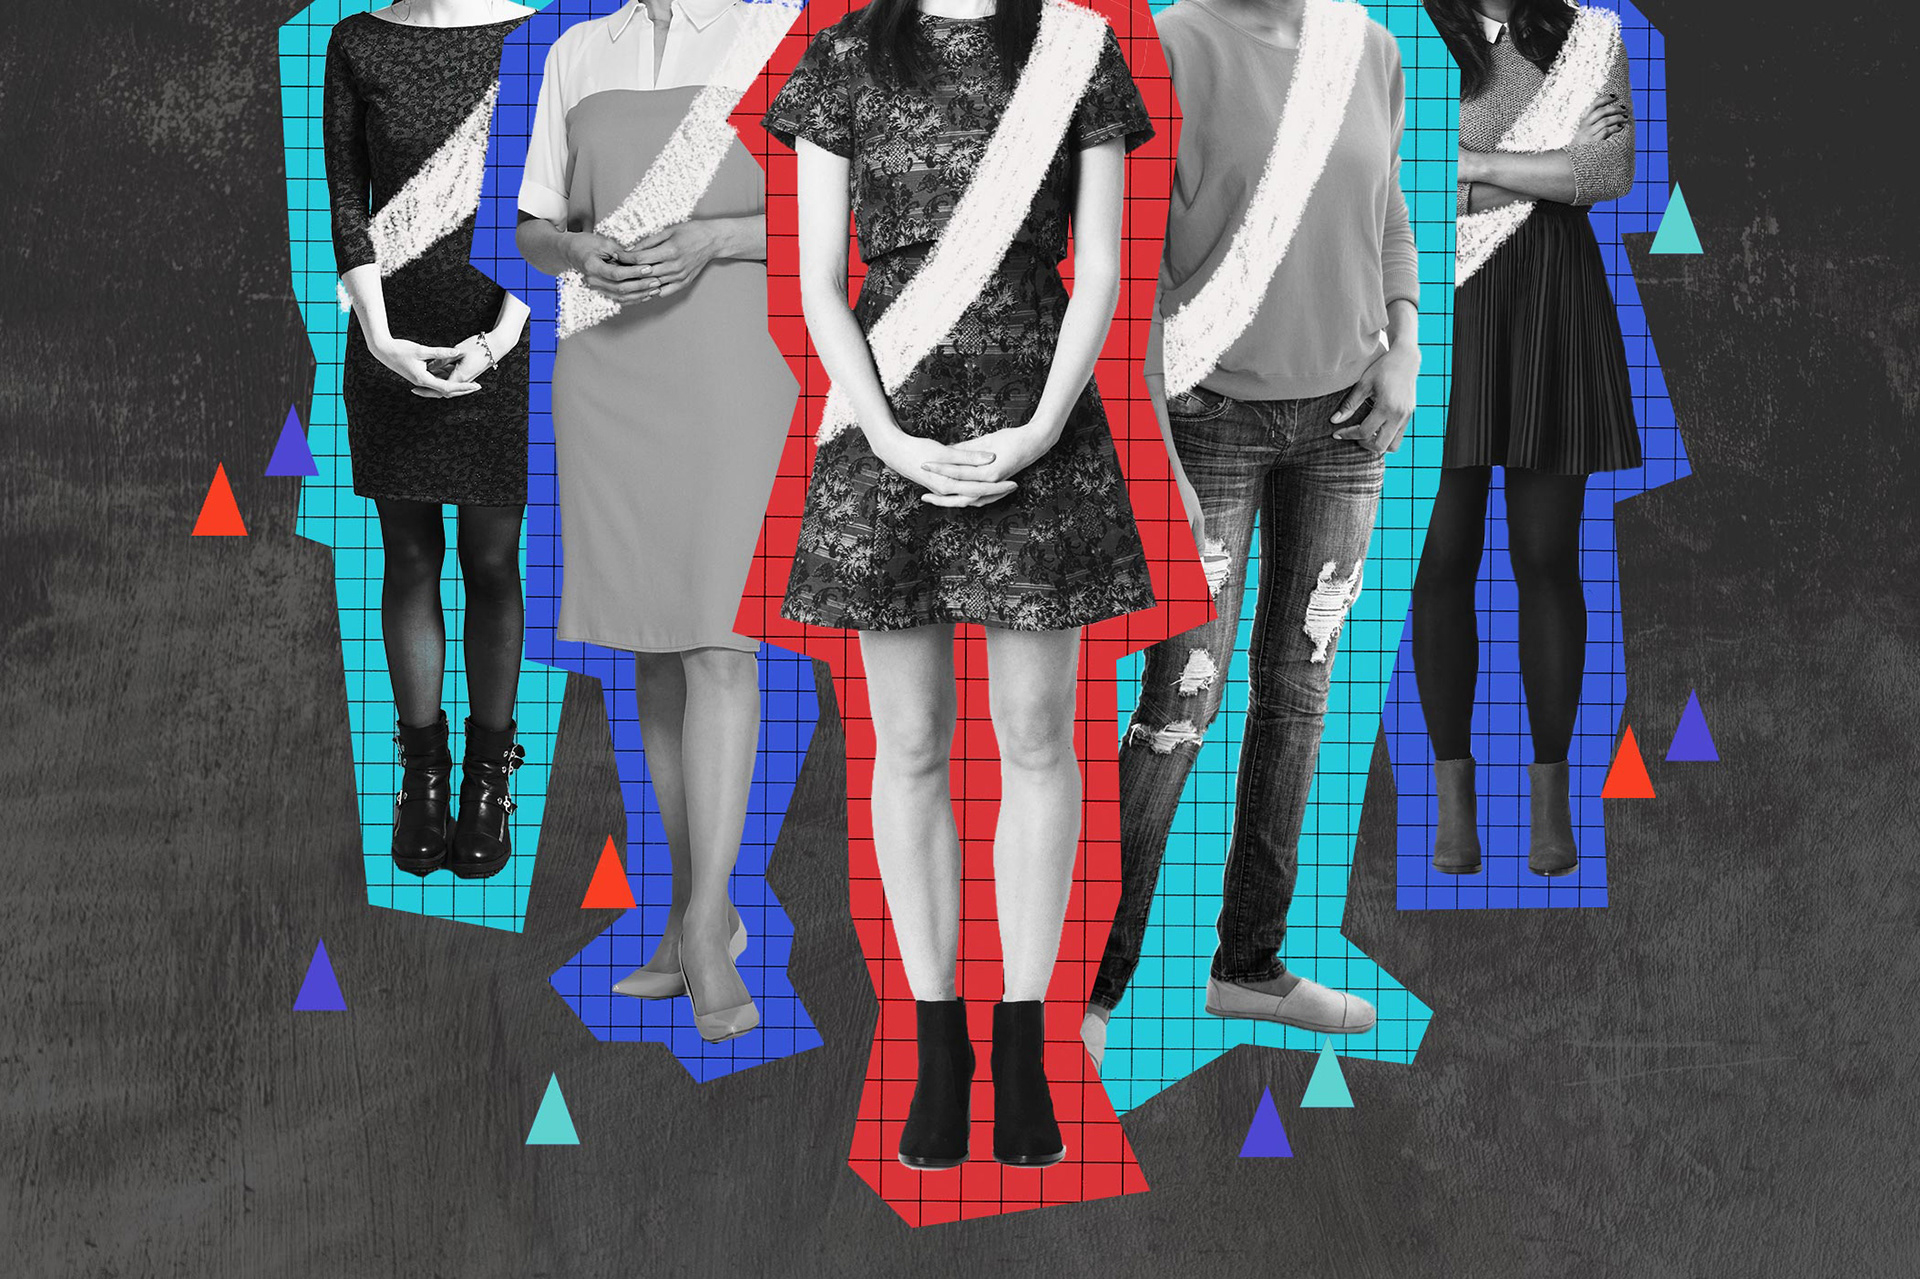
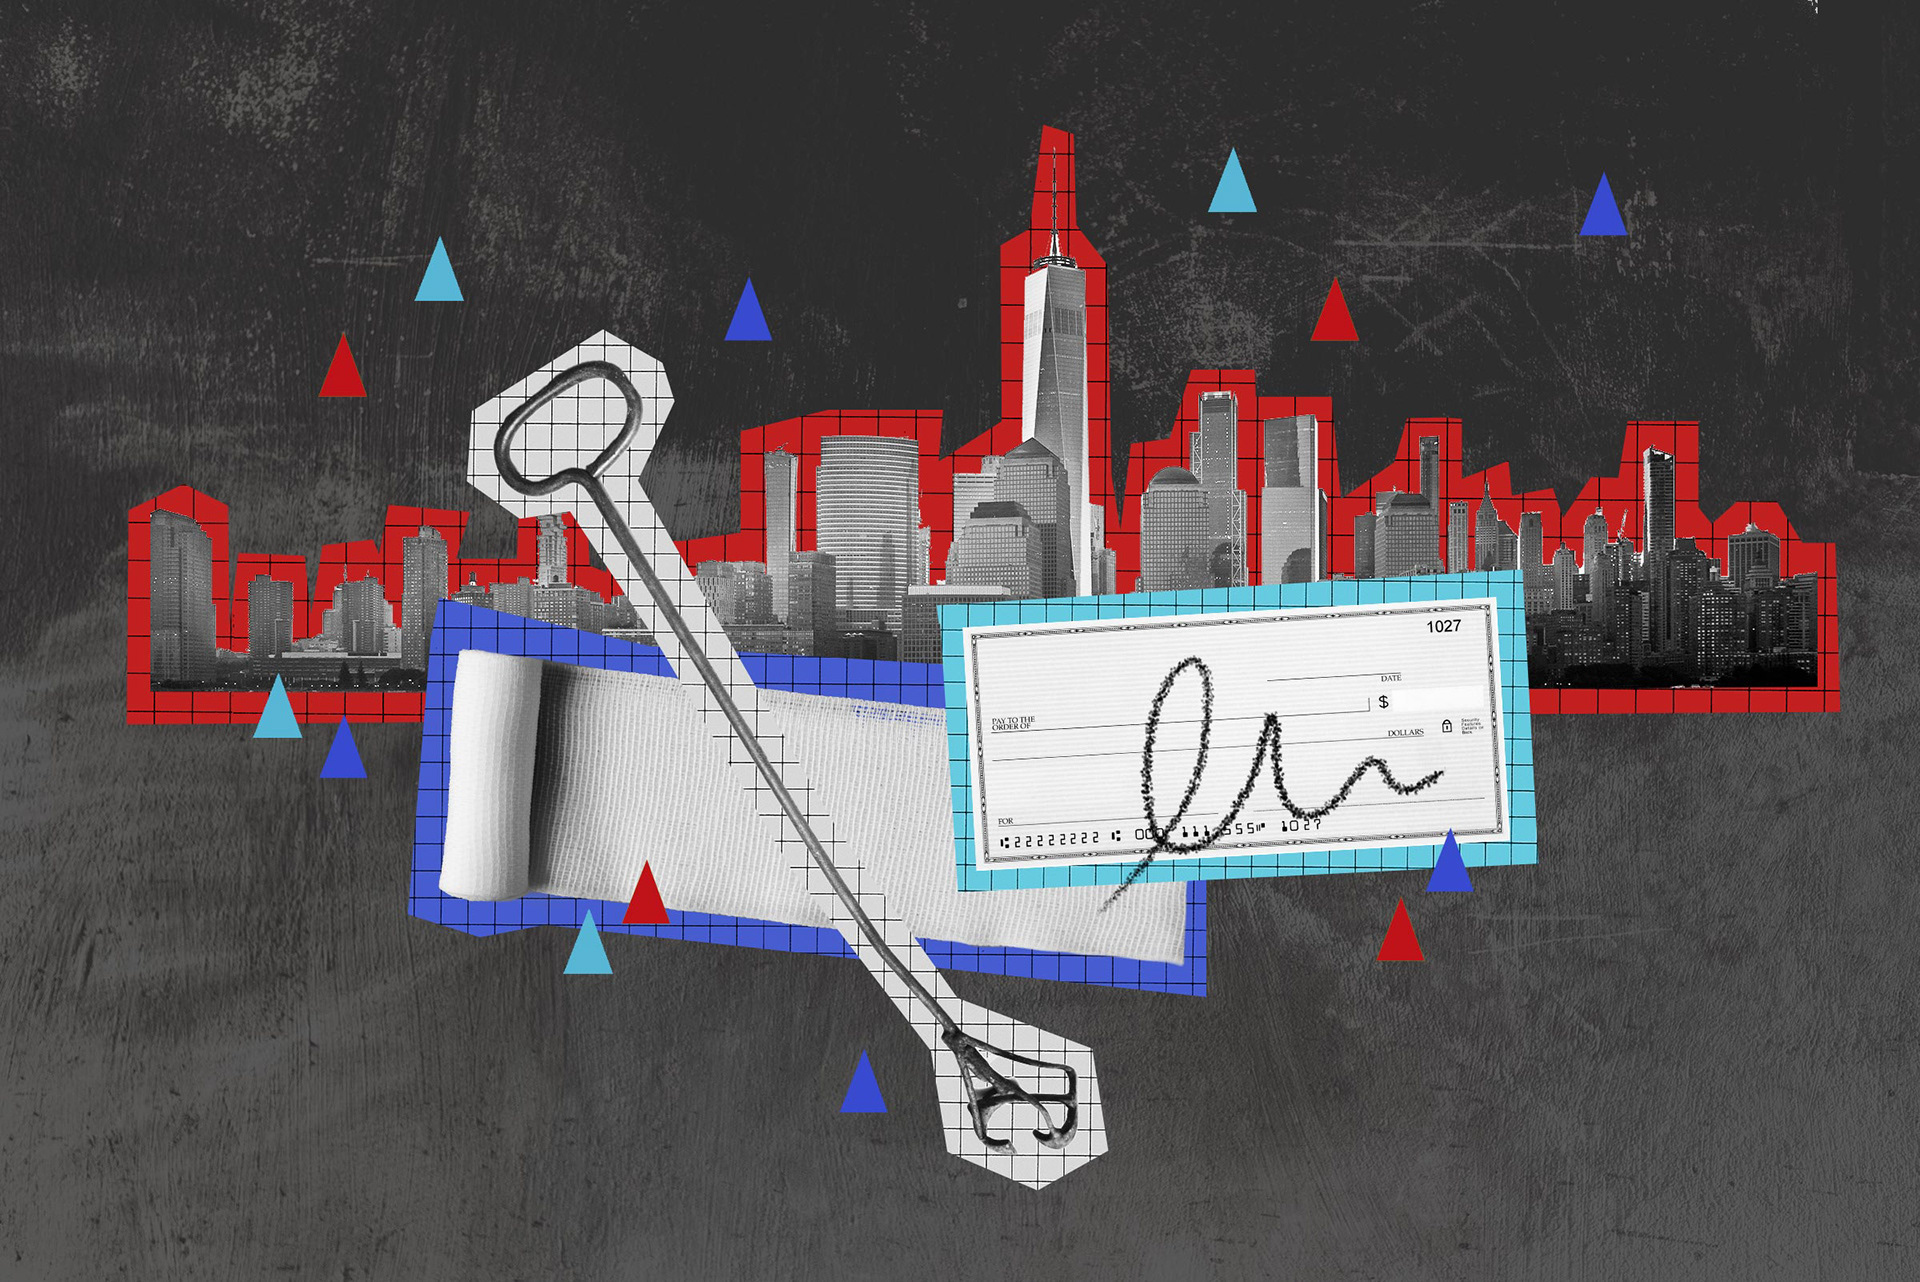
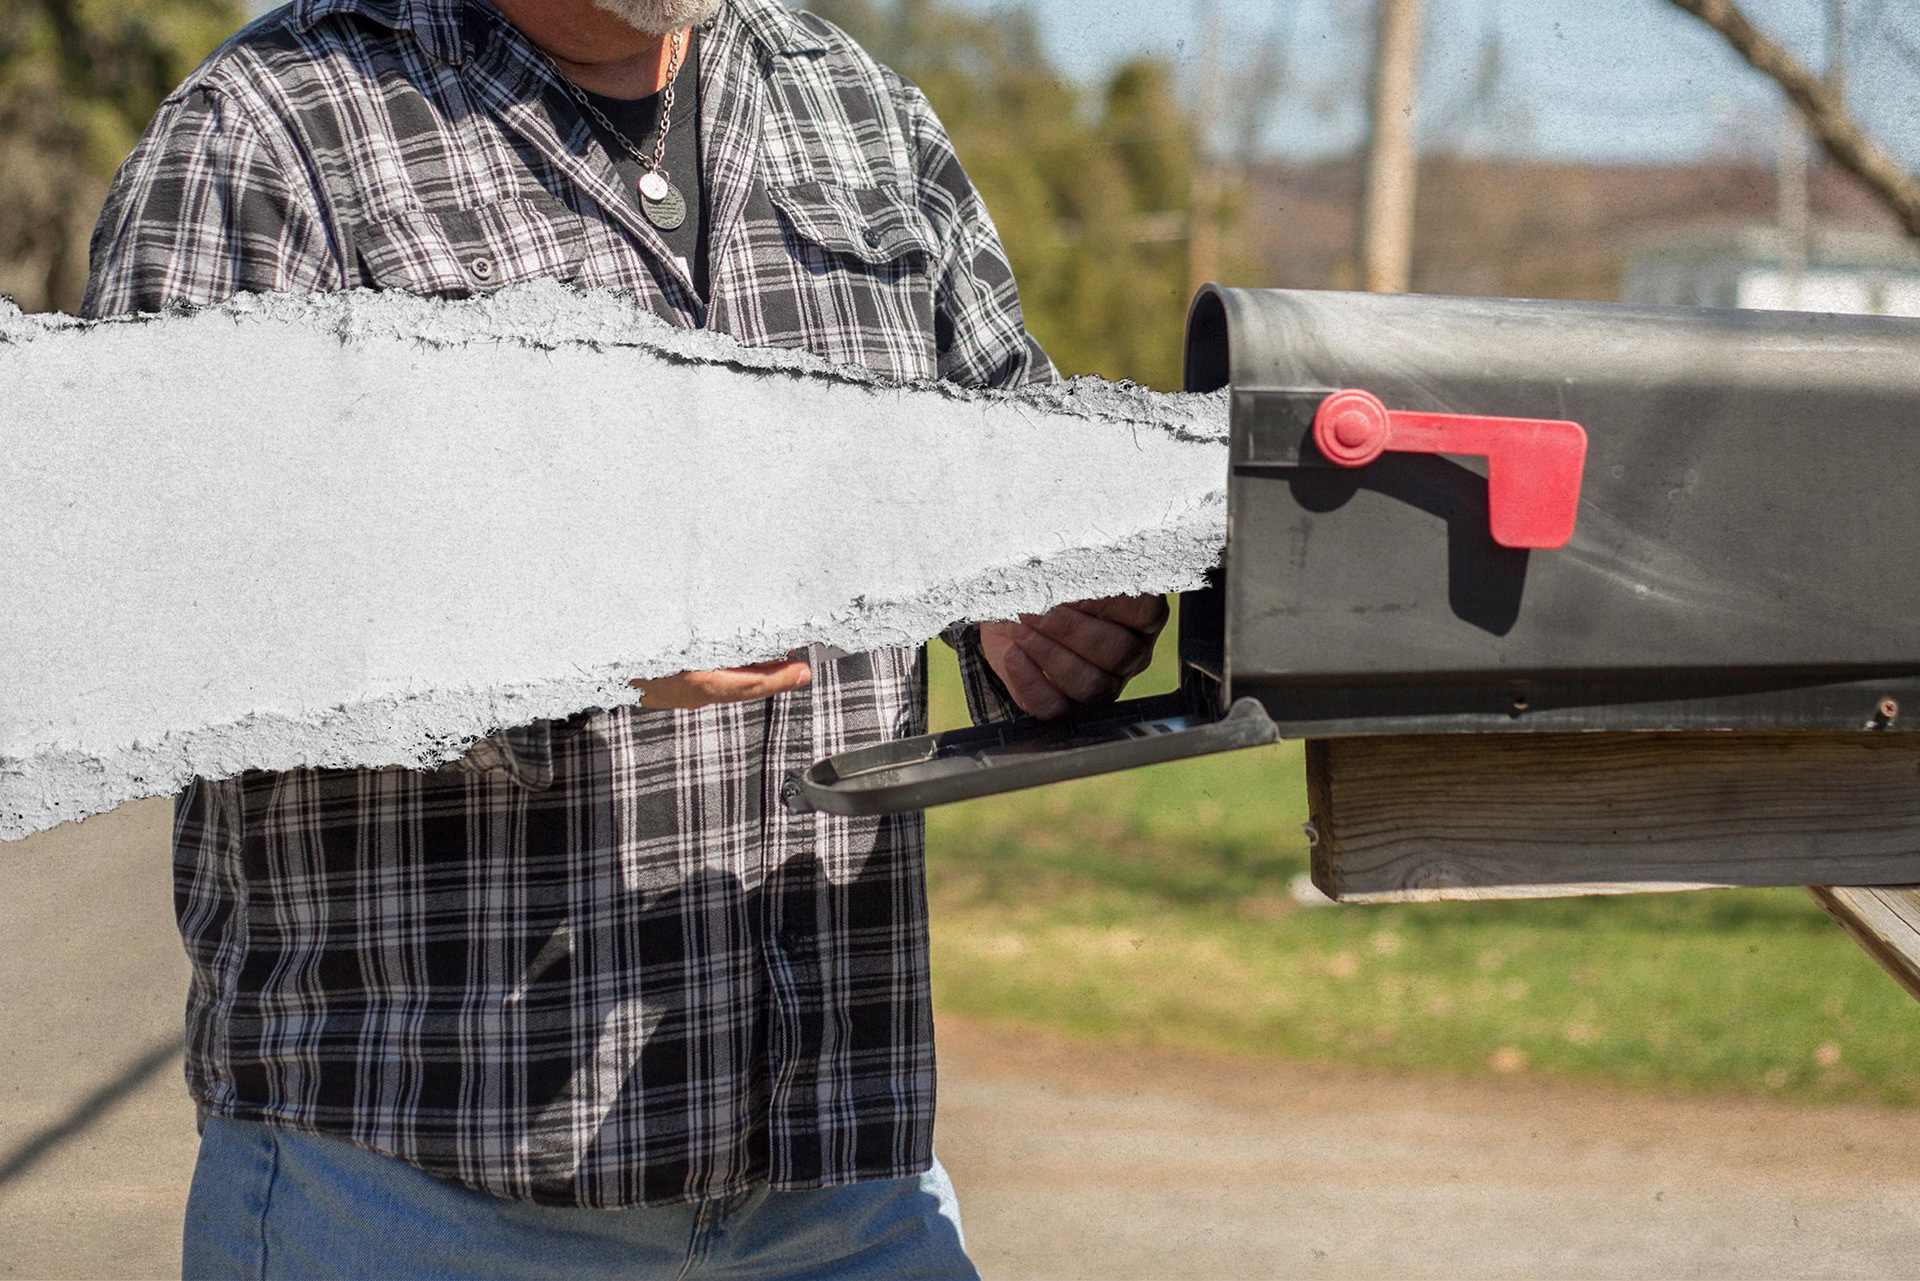
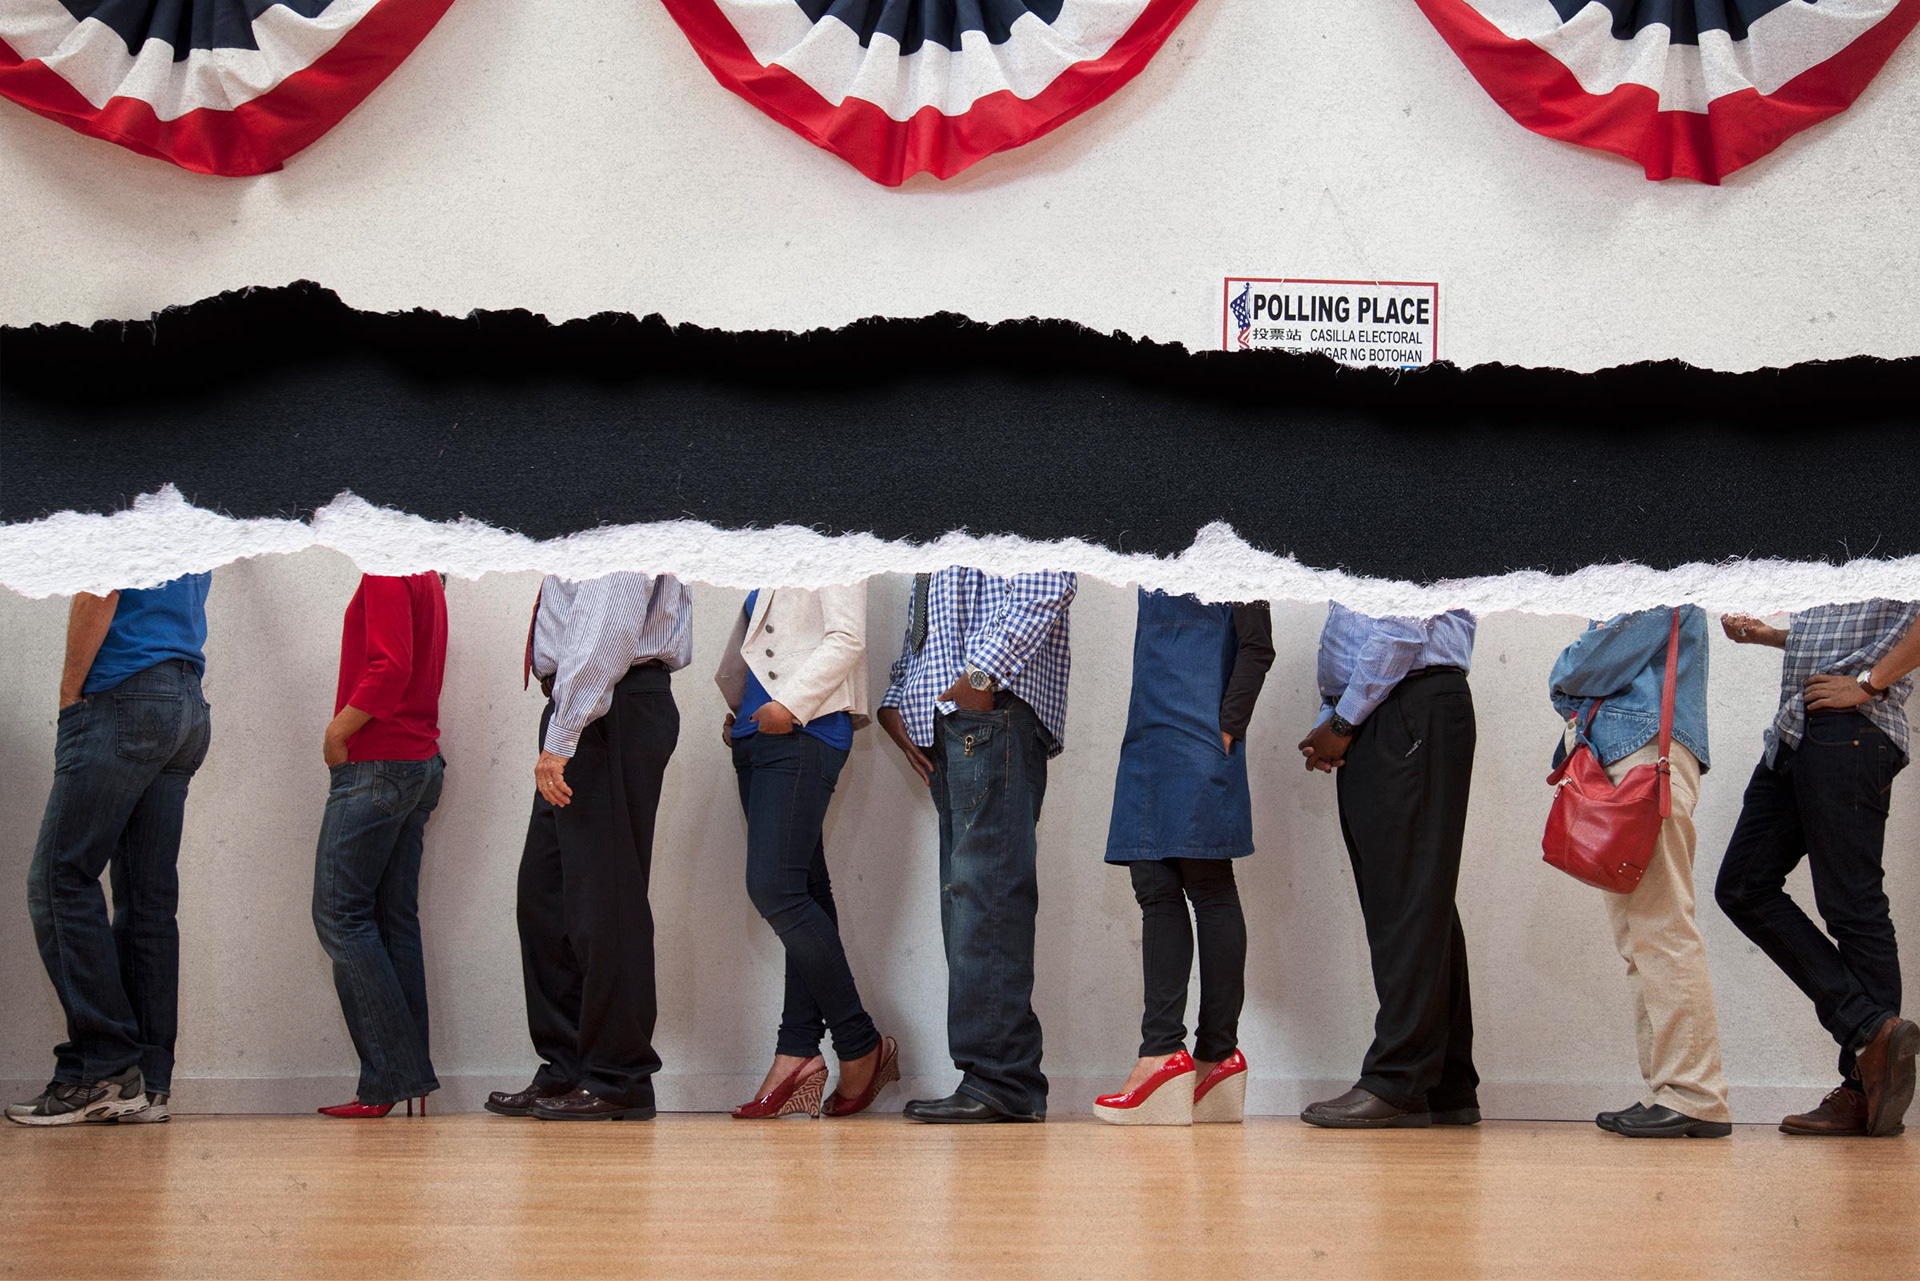
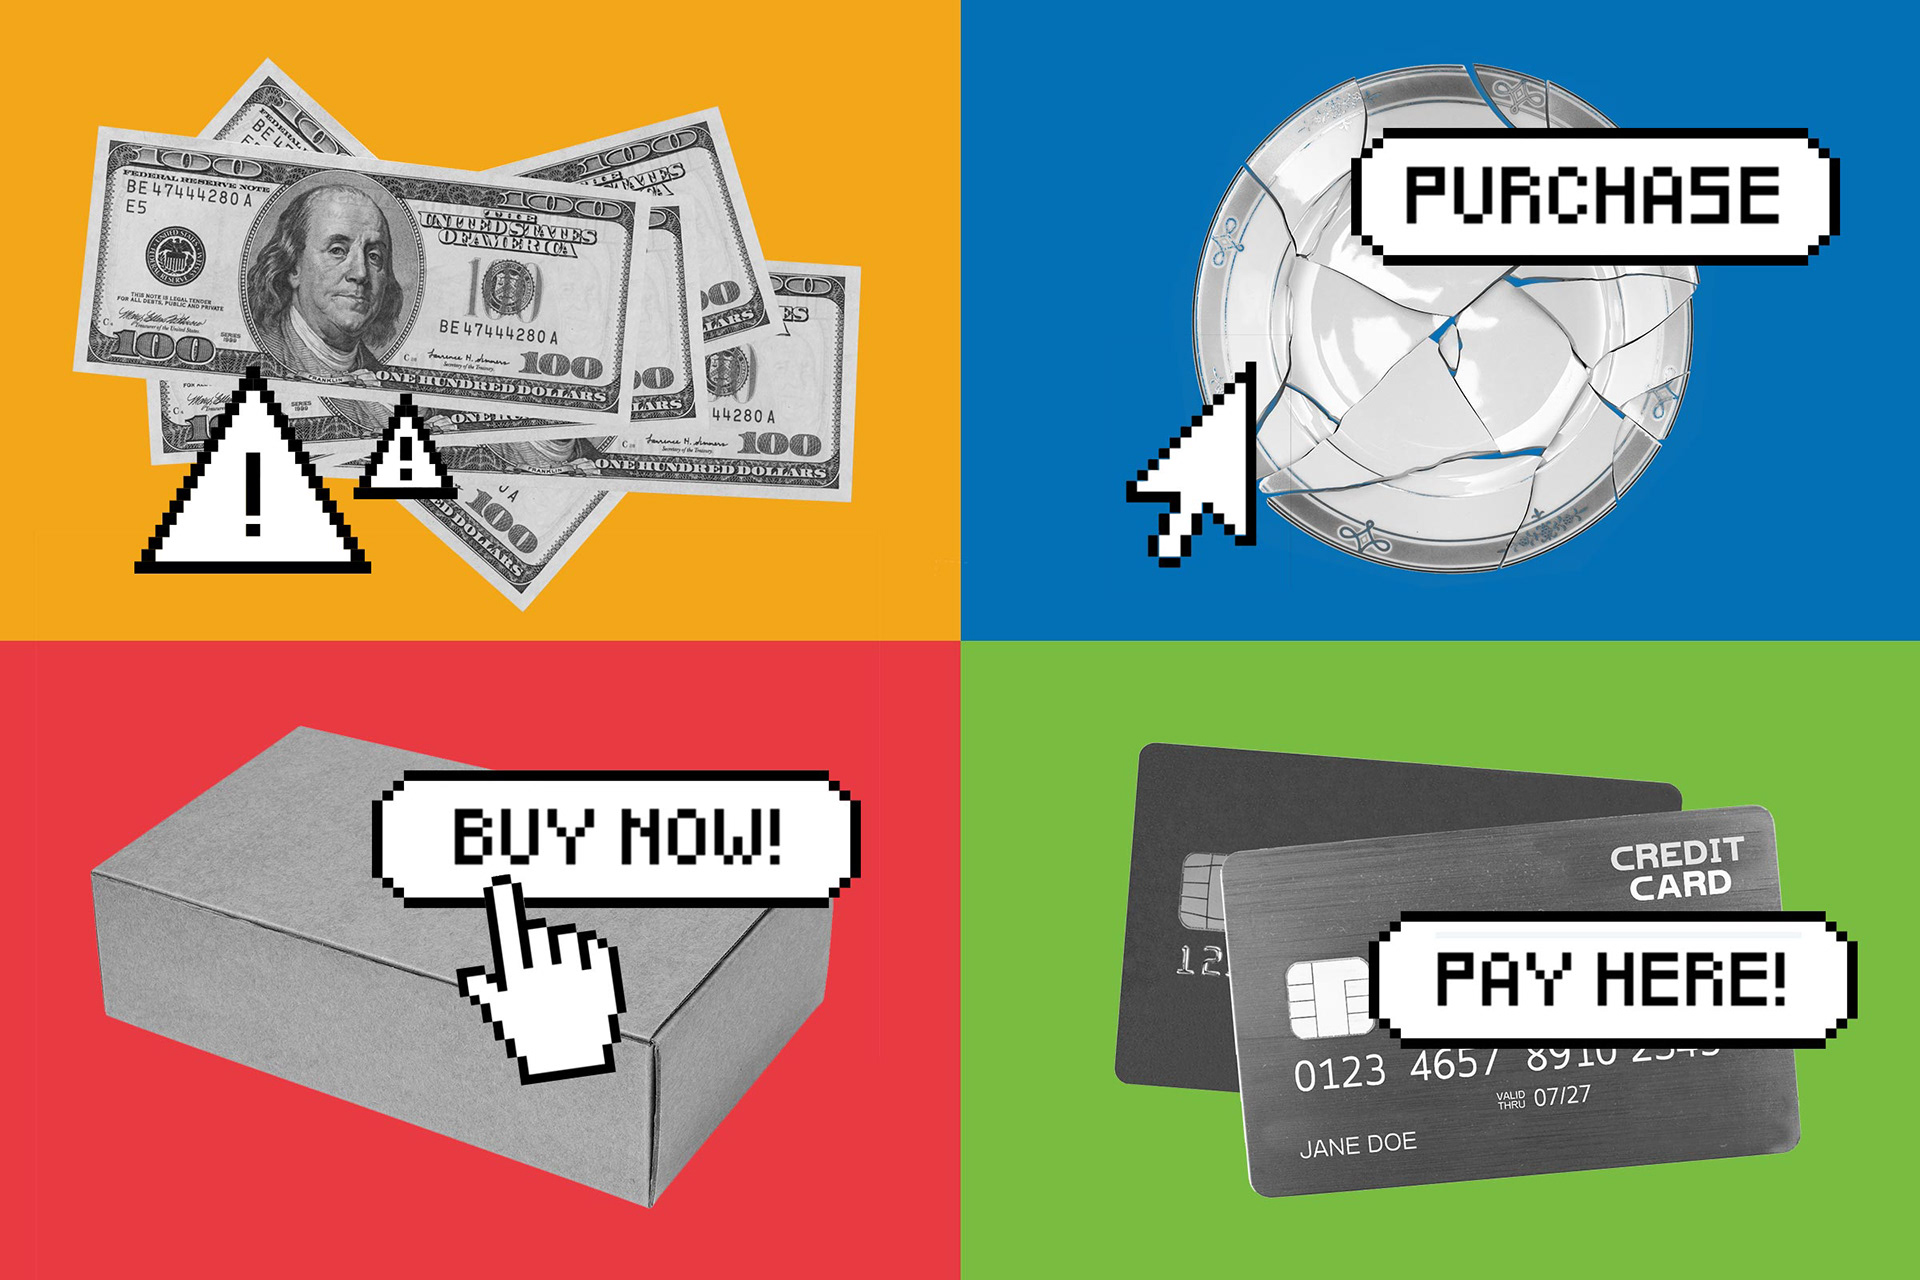
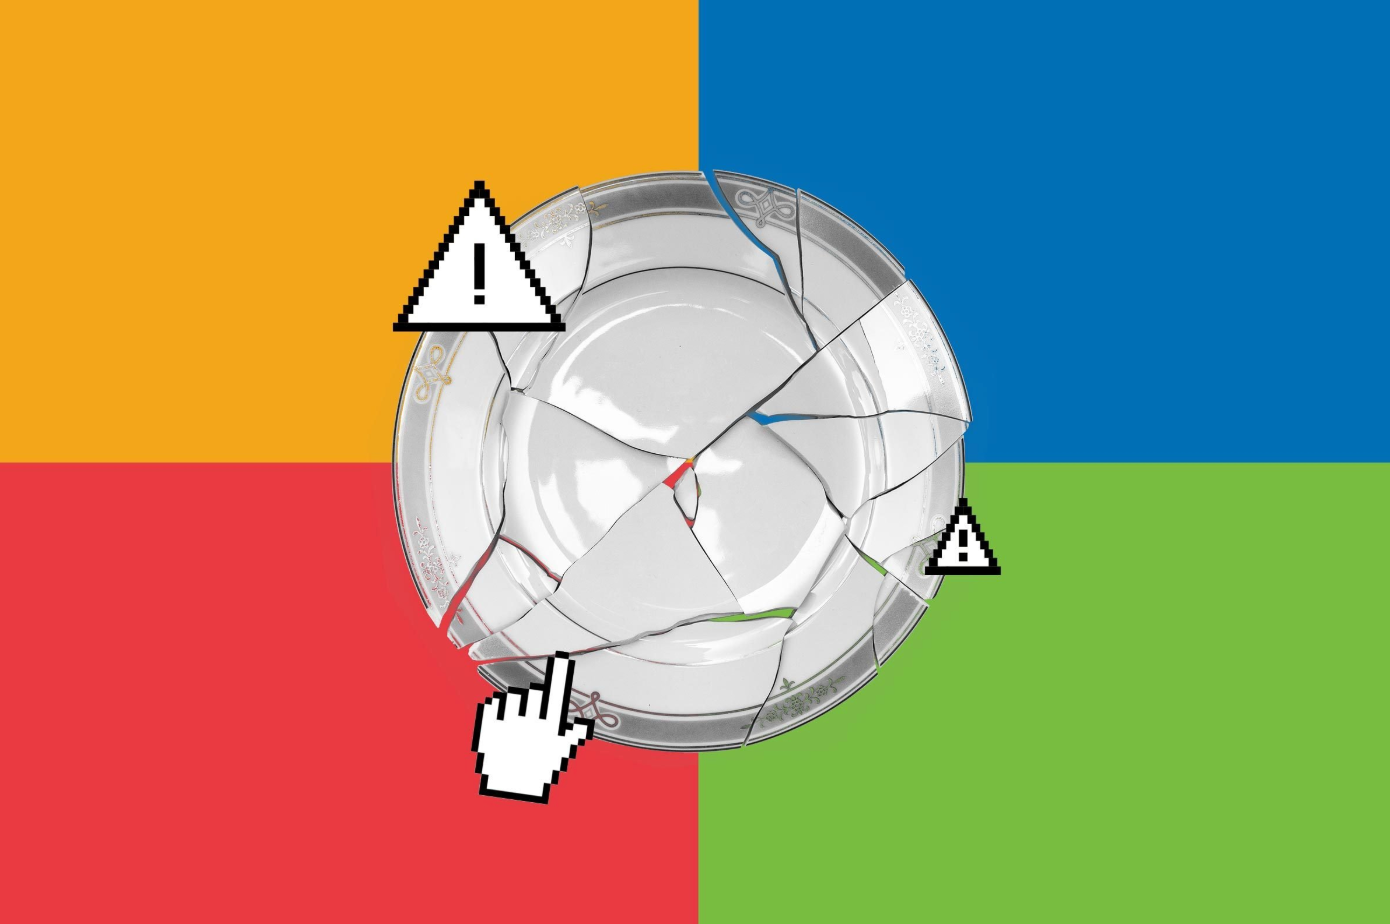
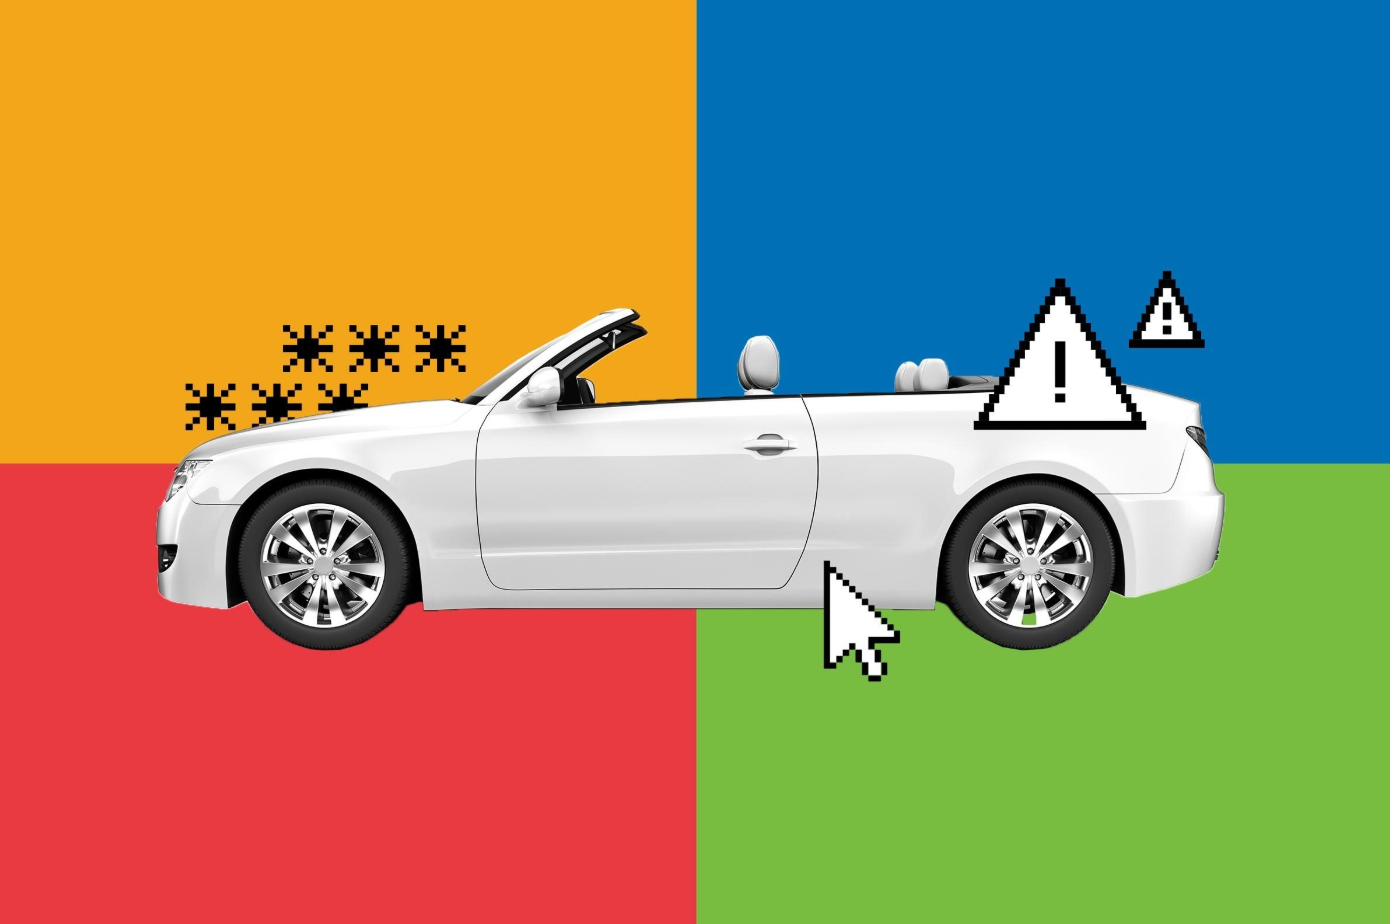
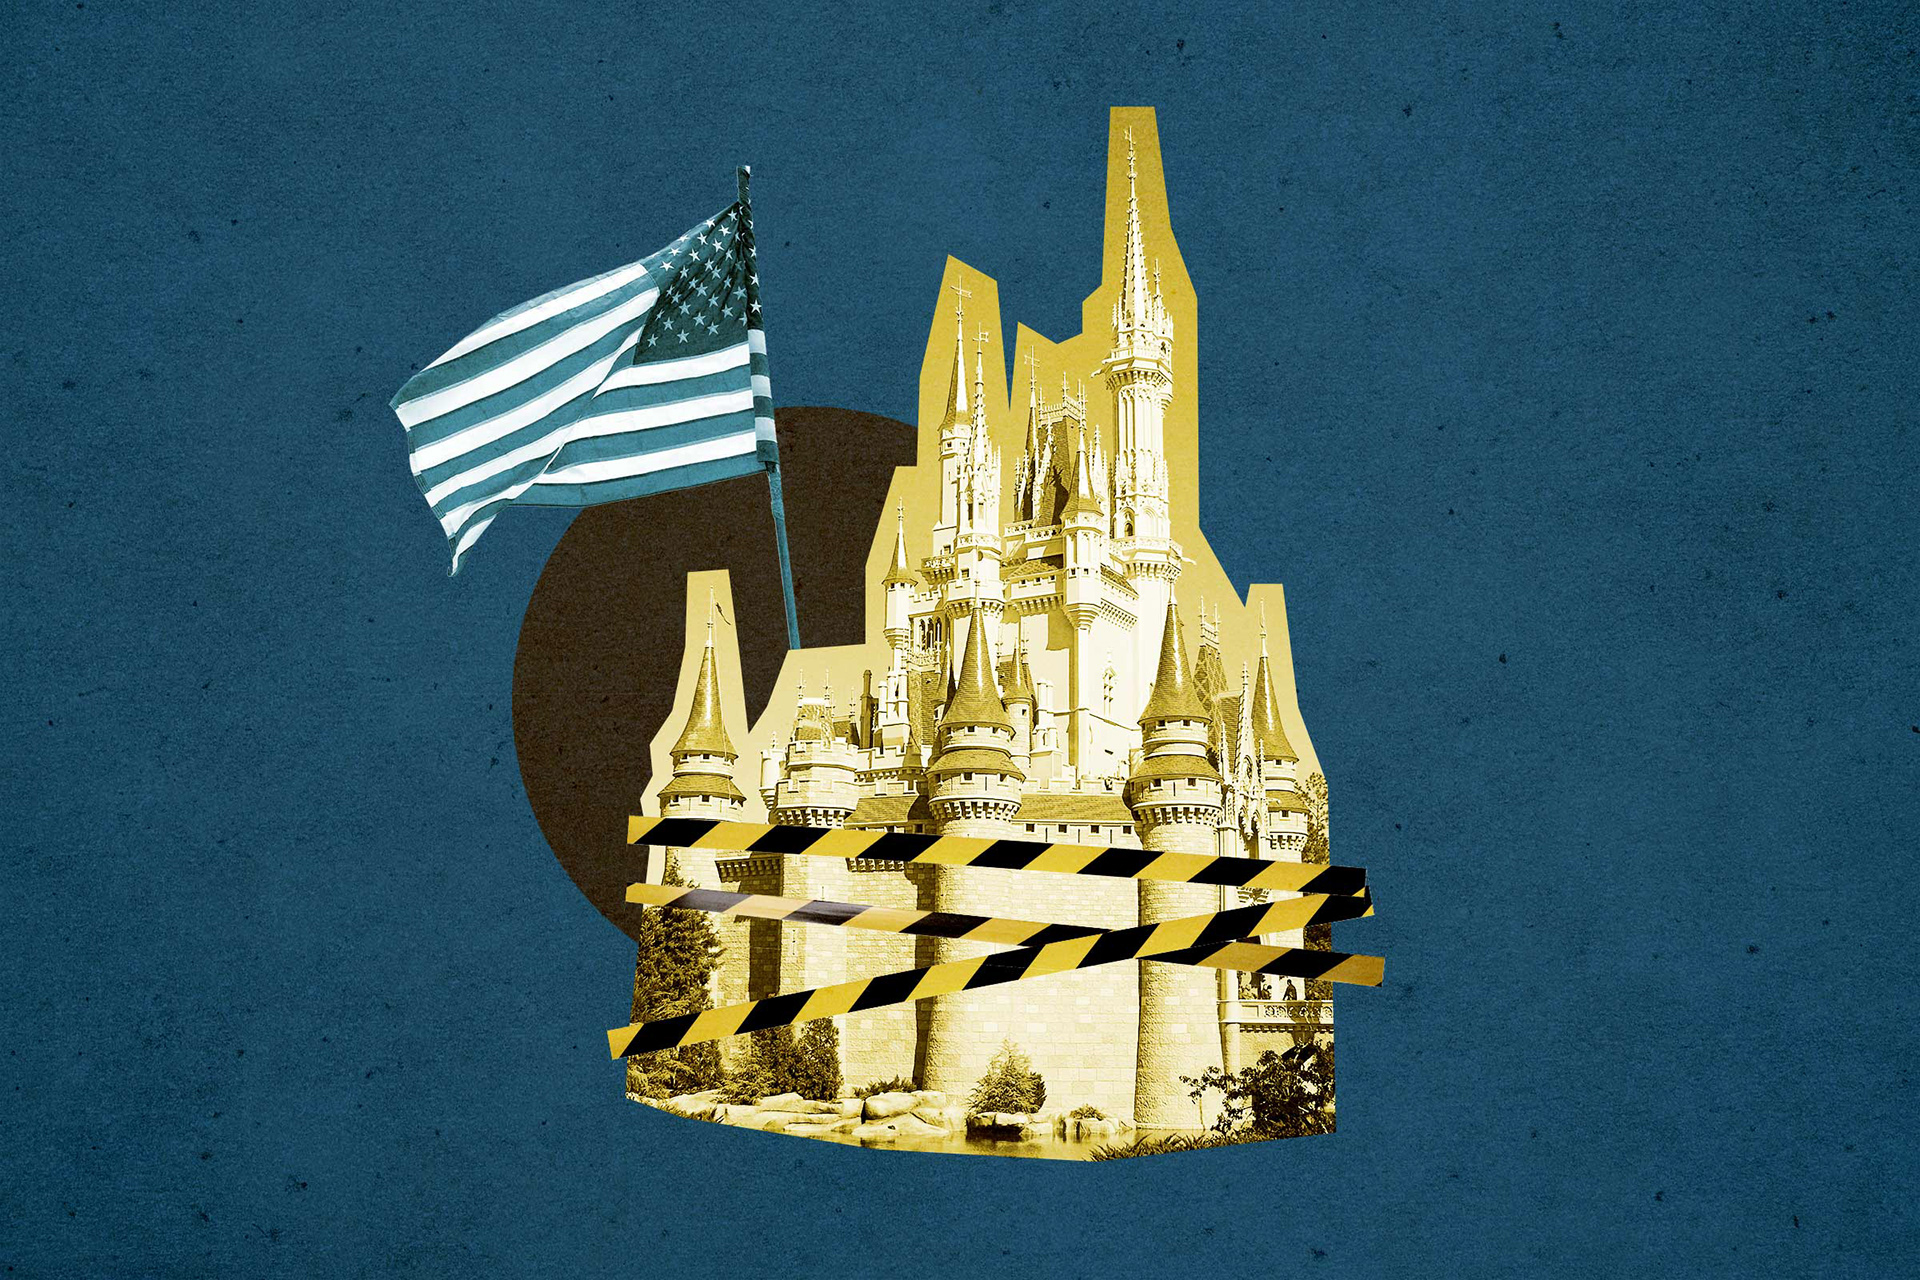
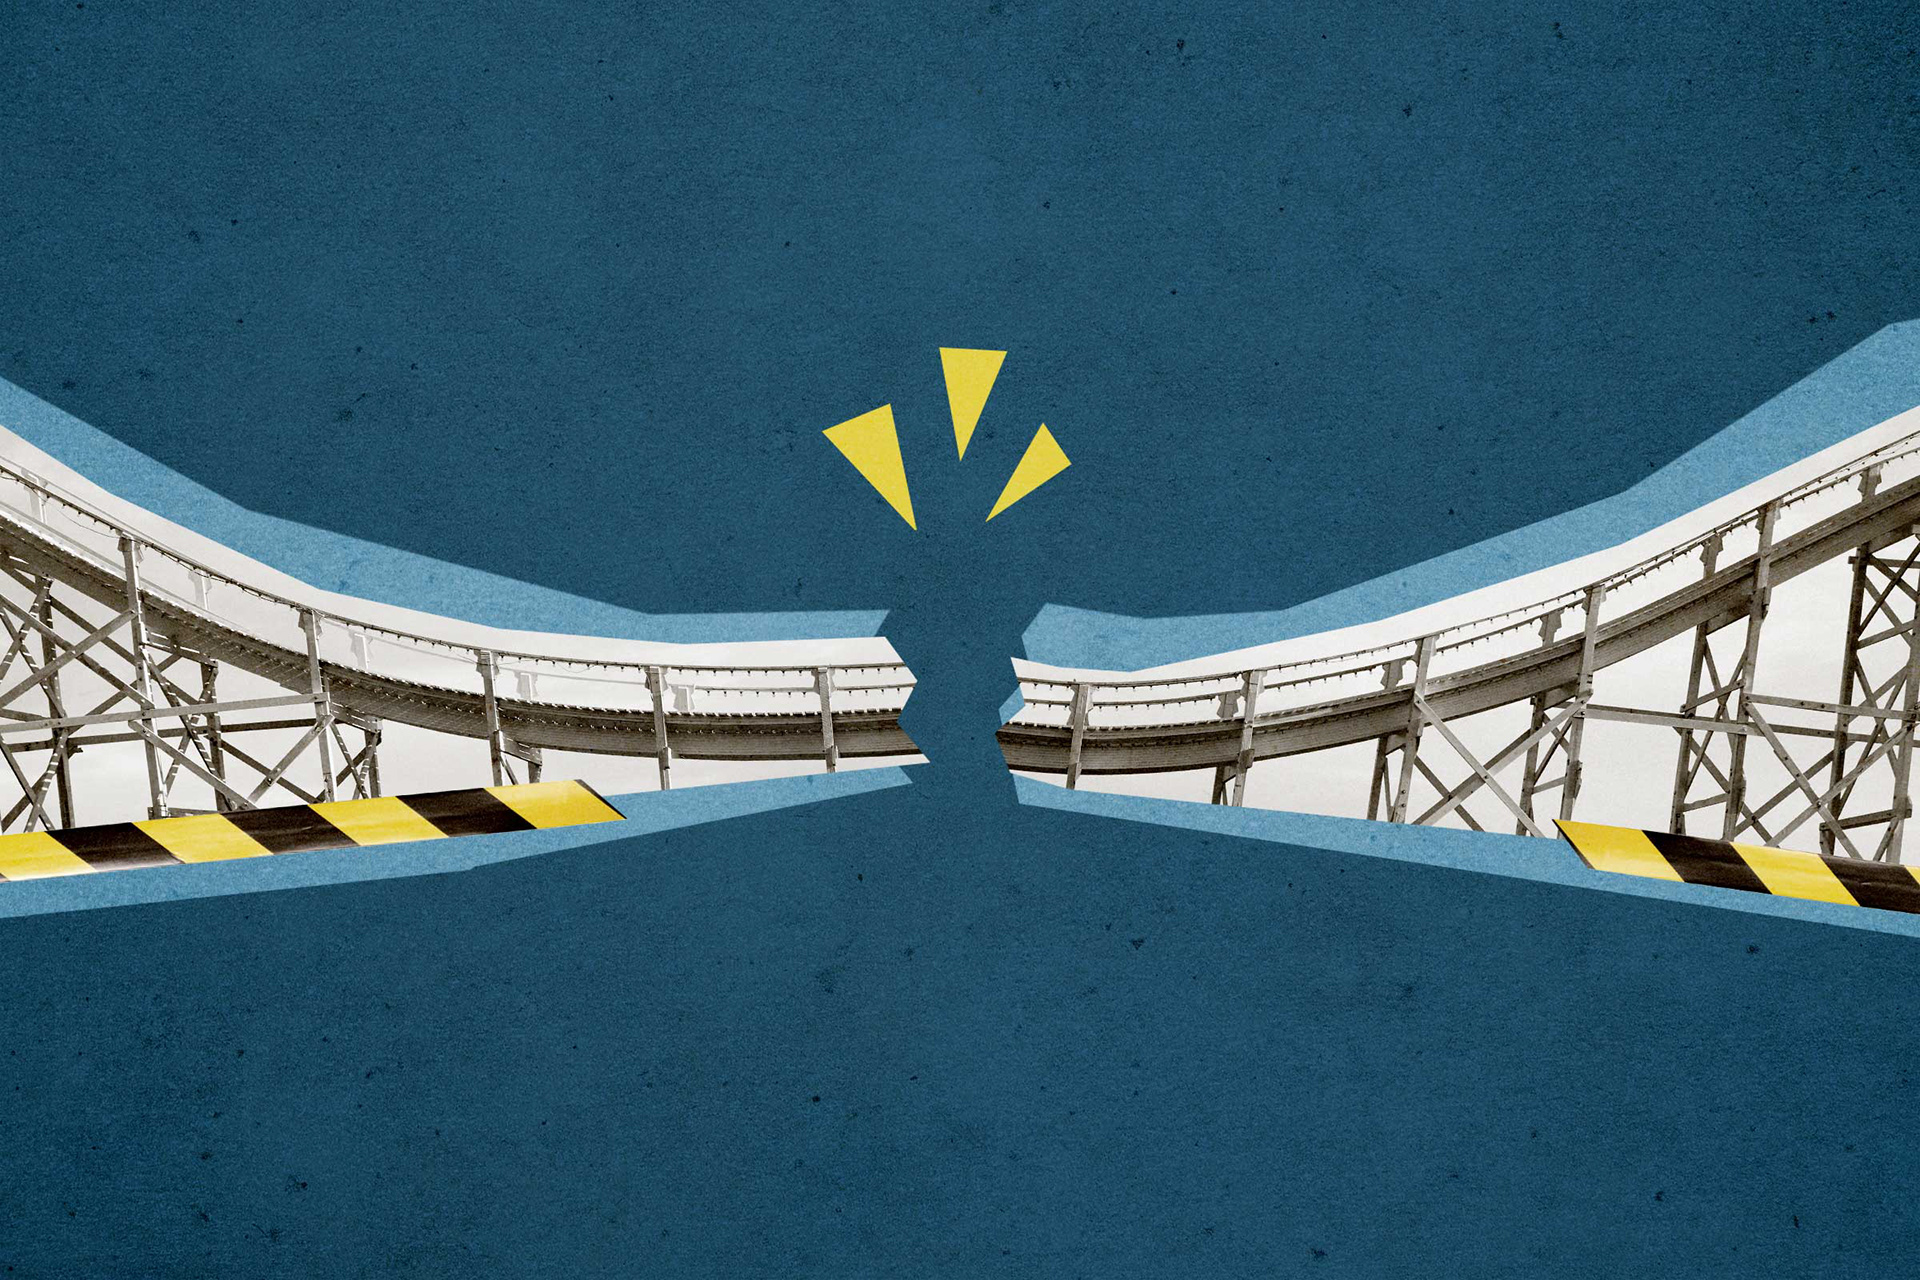
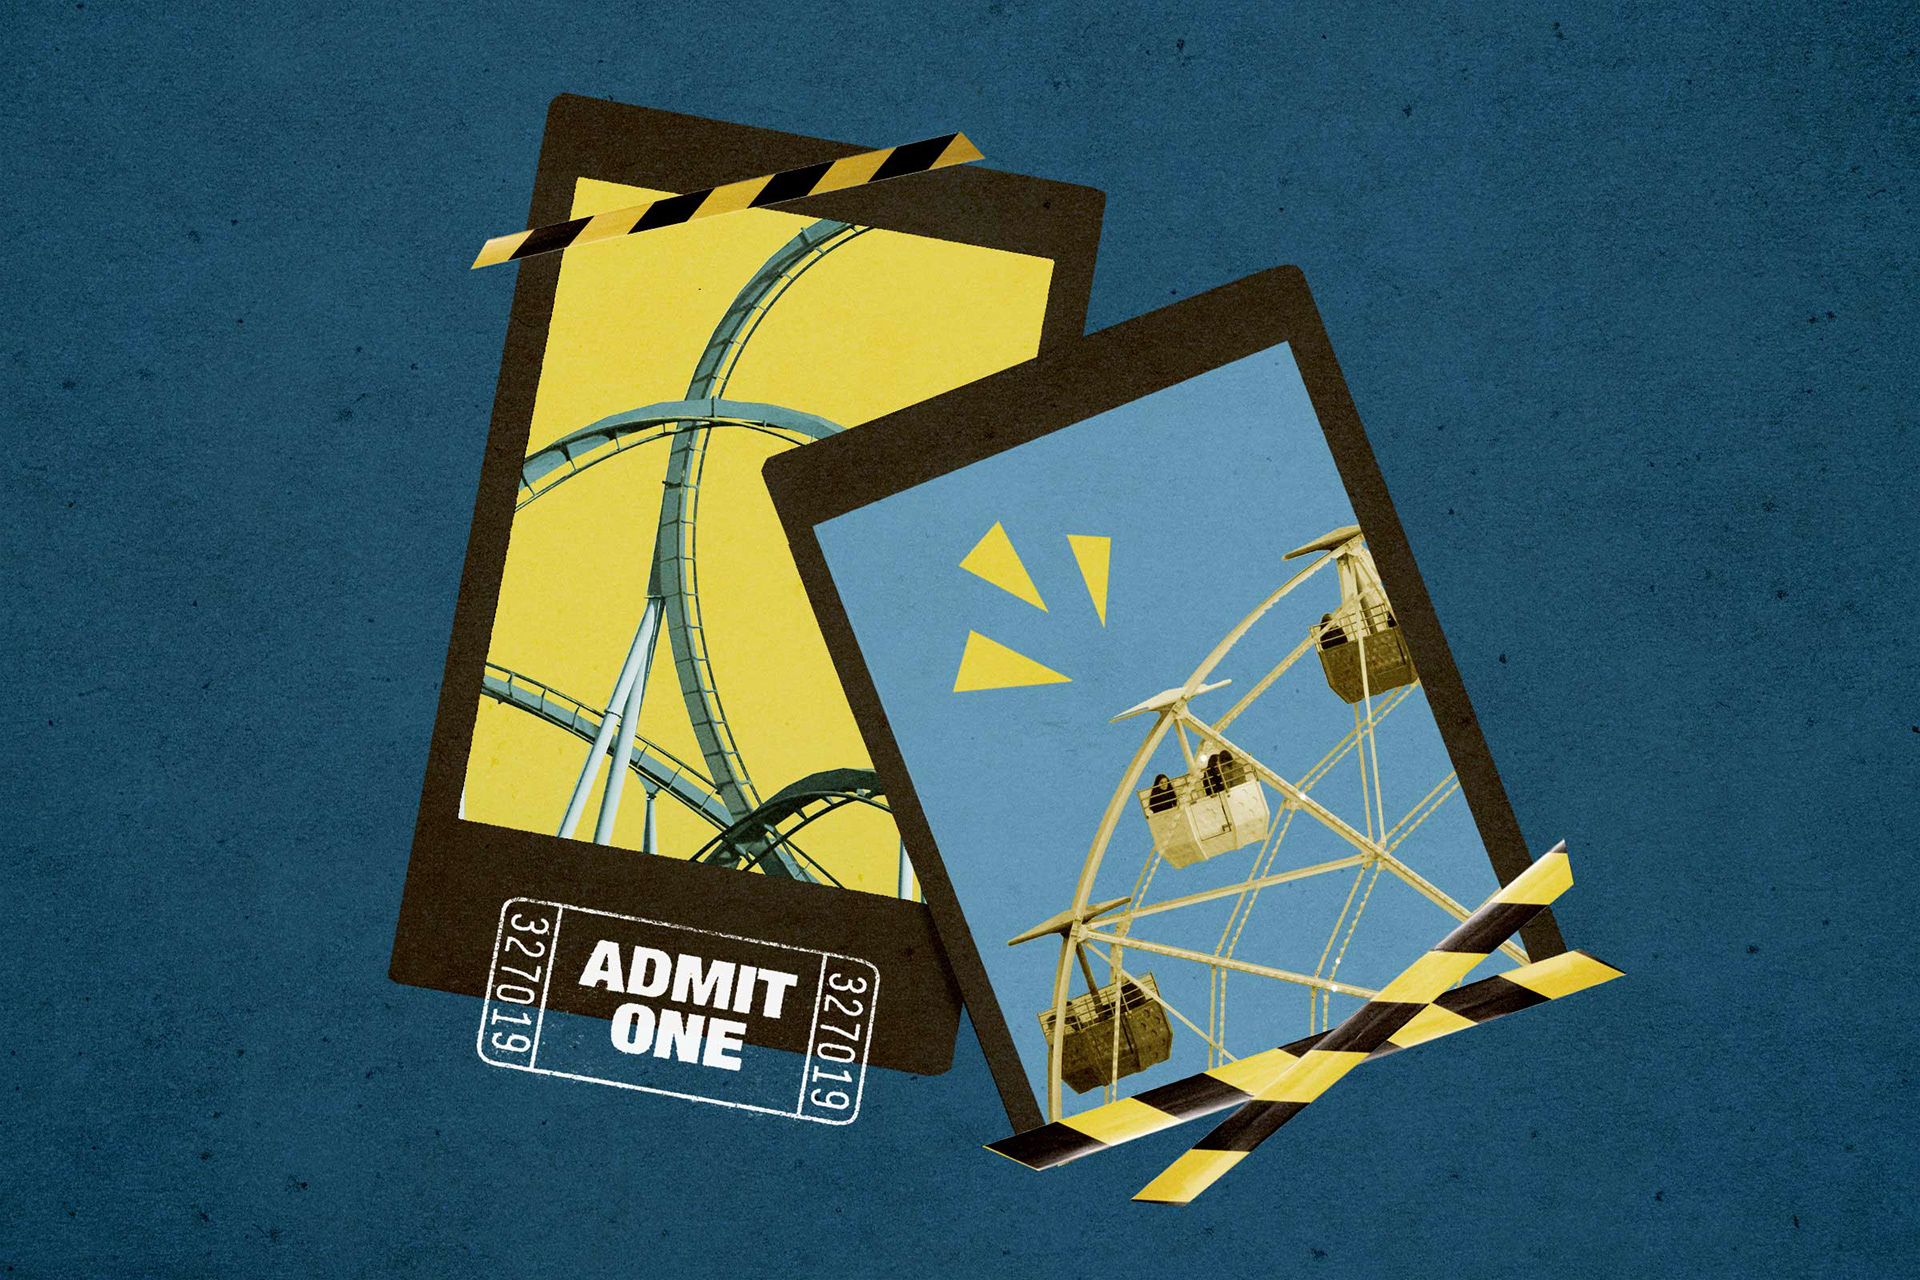
As a digital visuals assistant at Reader's Digest, I created visuals to accompany web stories on the website and social media channels. Click any image below to enlarge.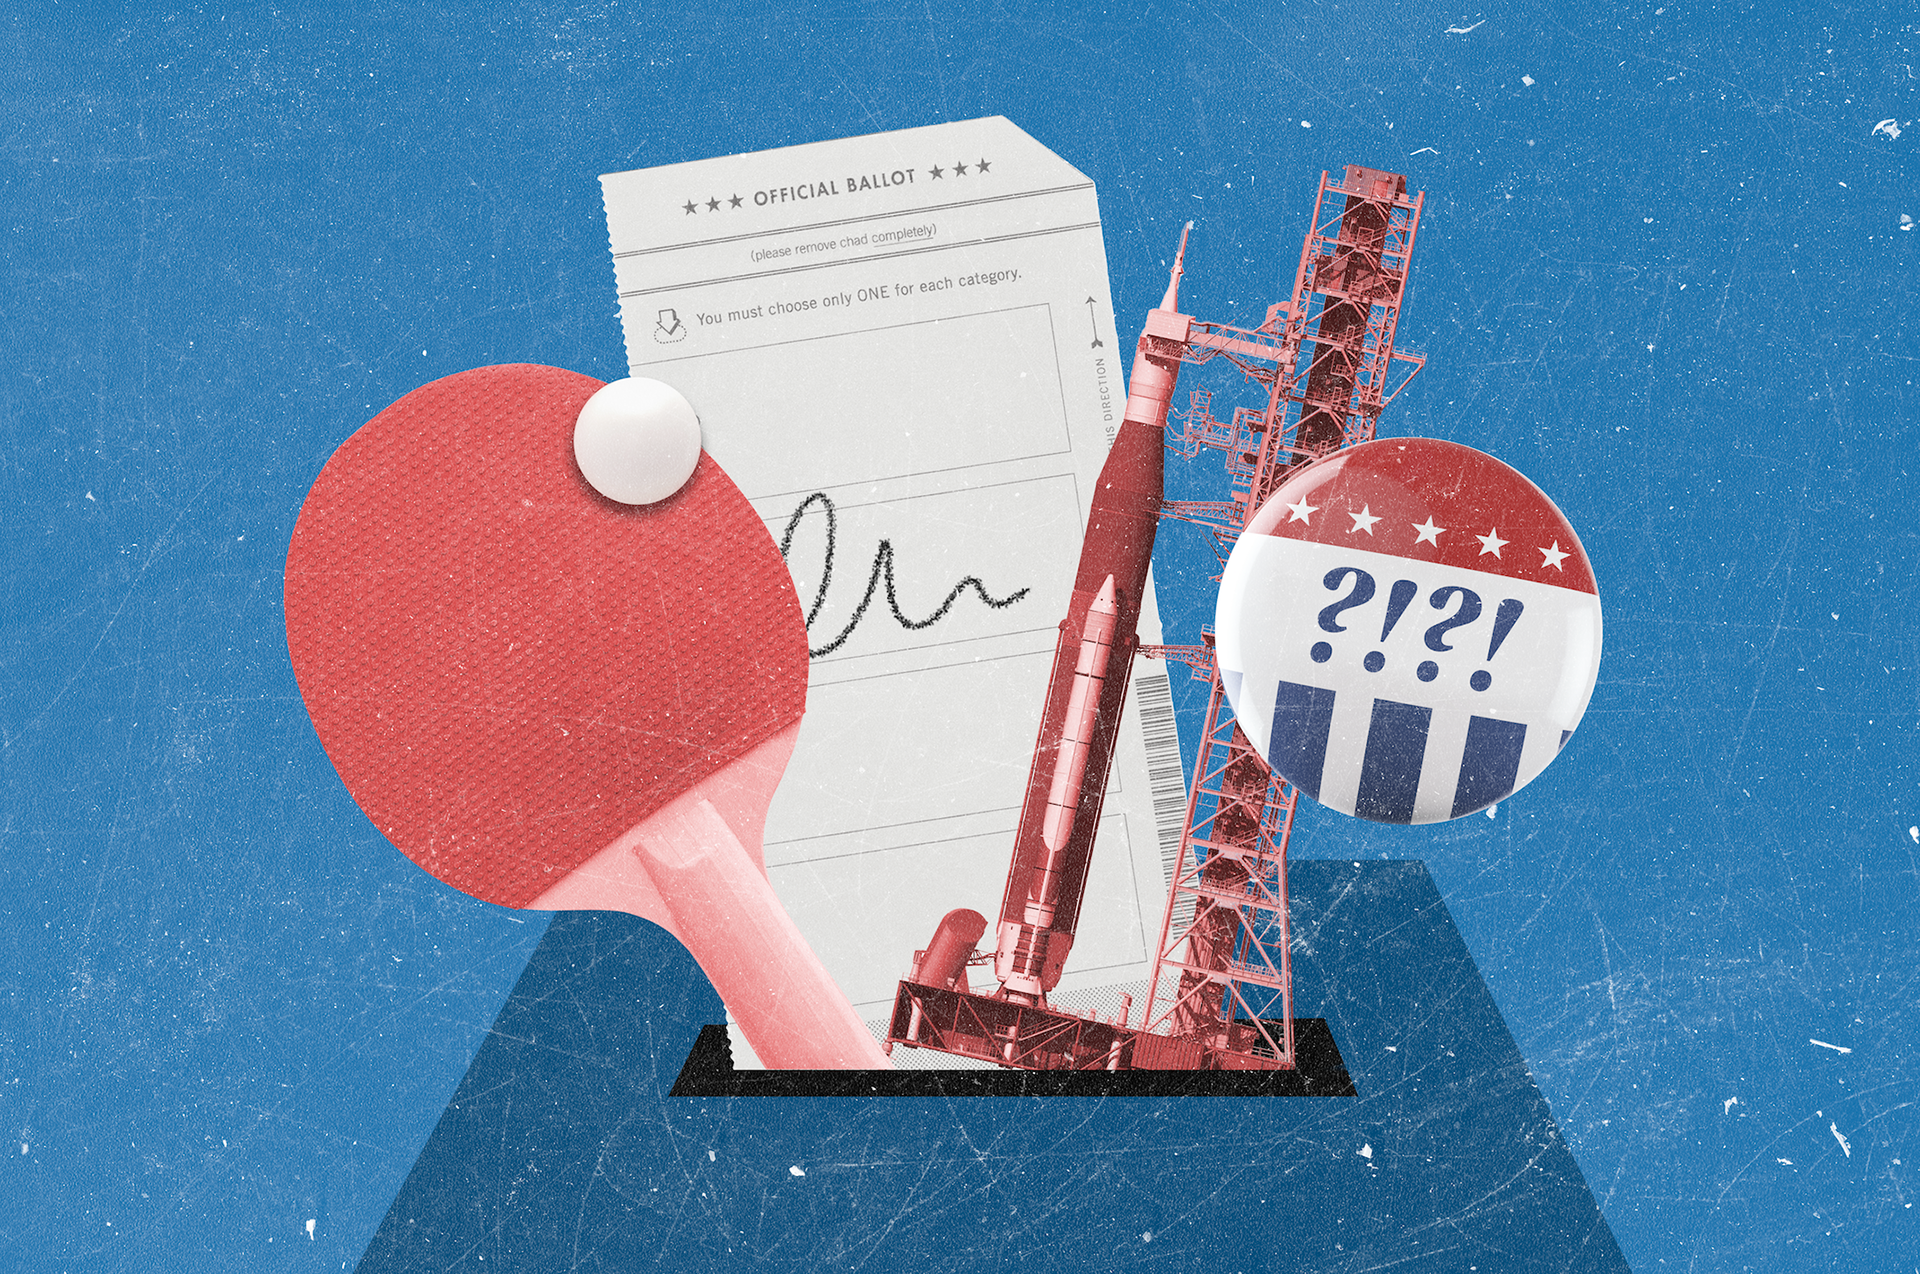







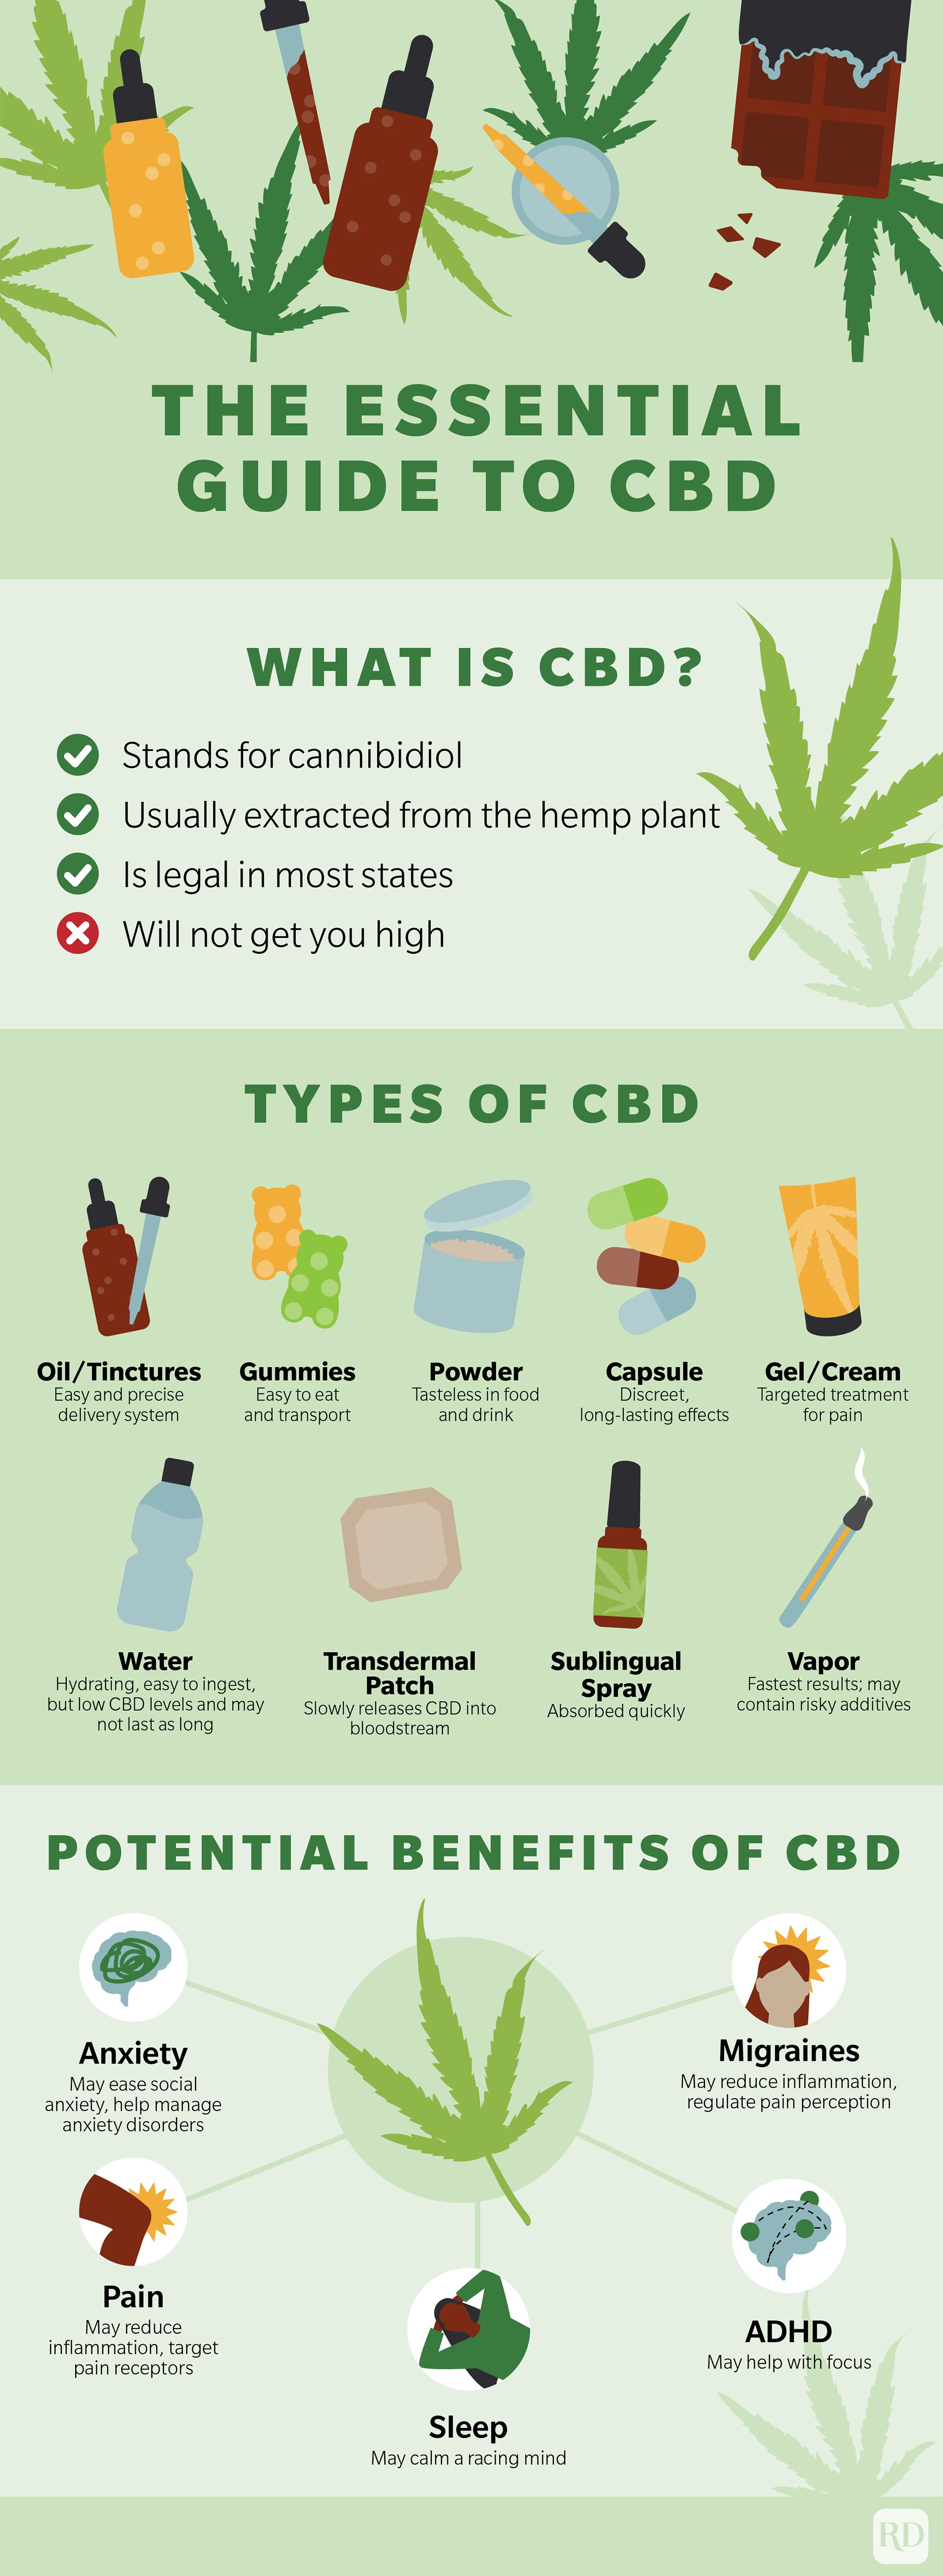
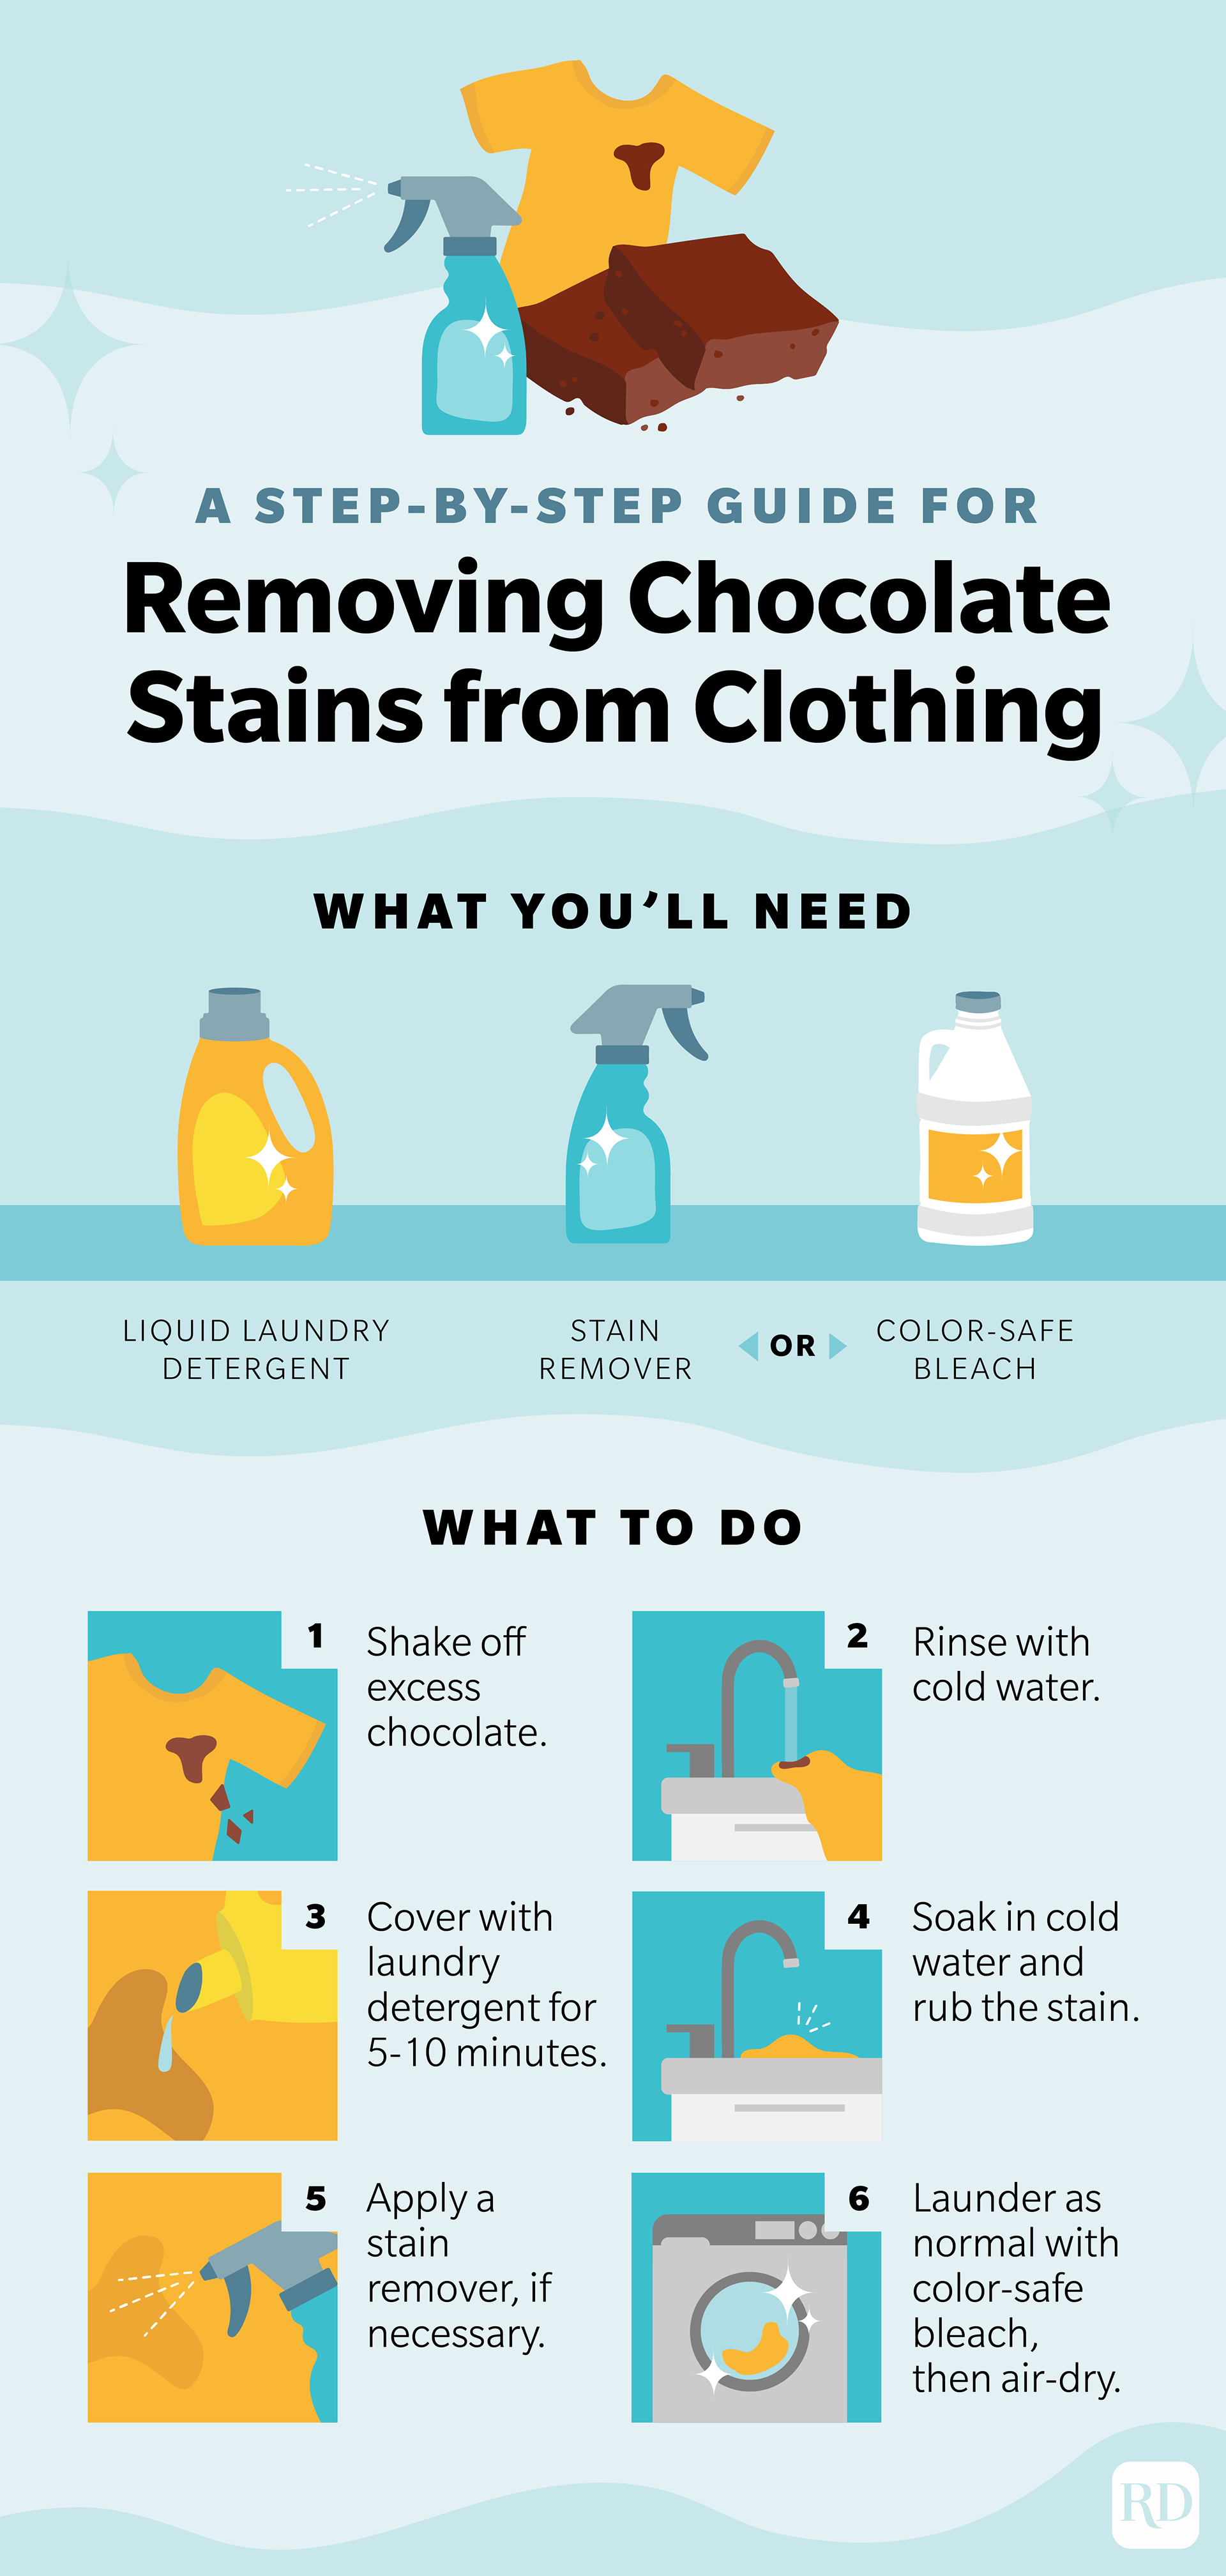
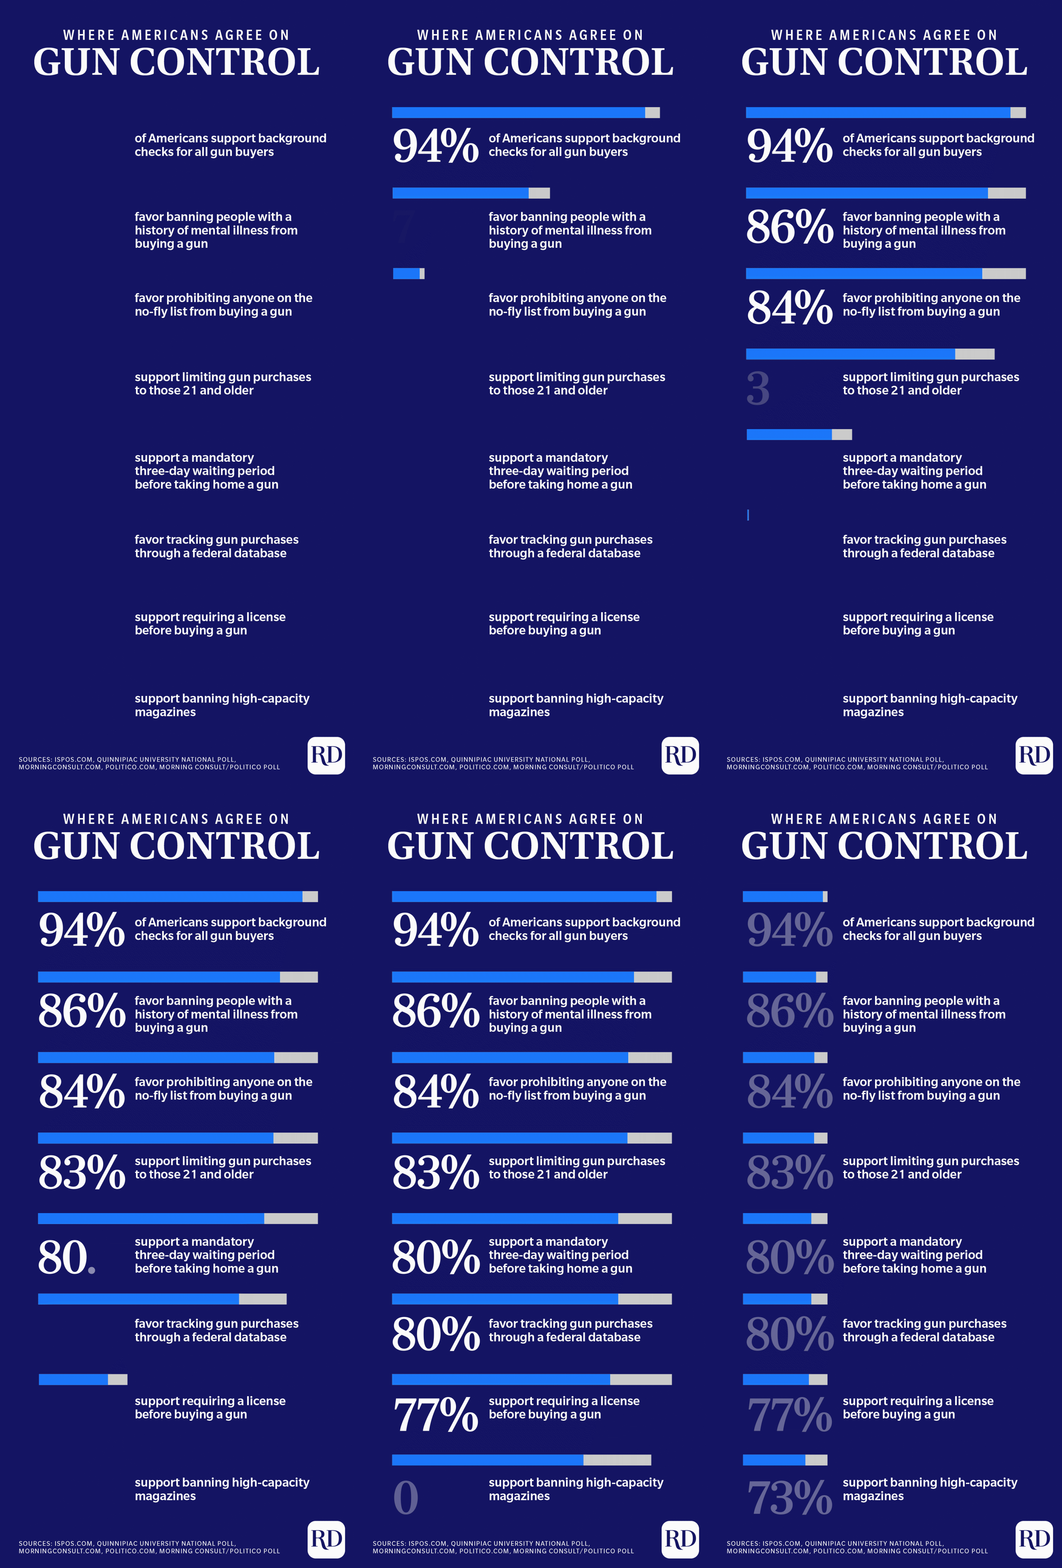
Infographics
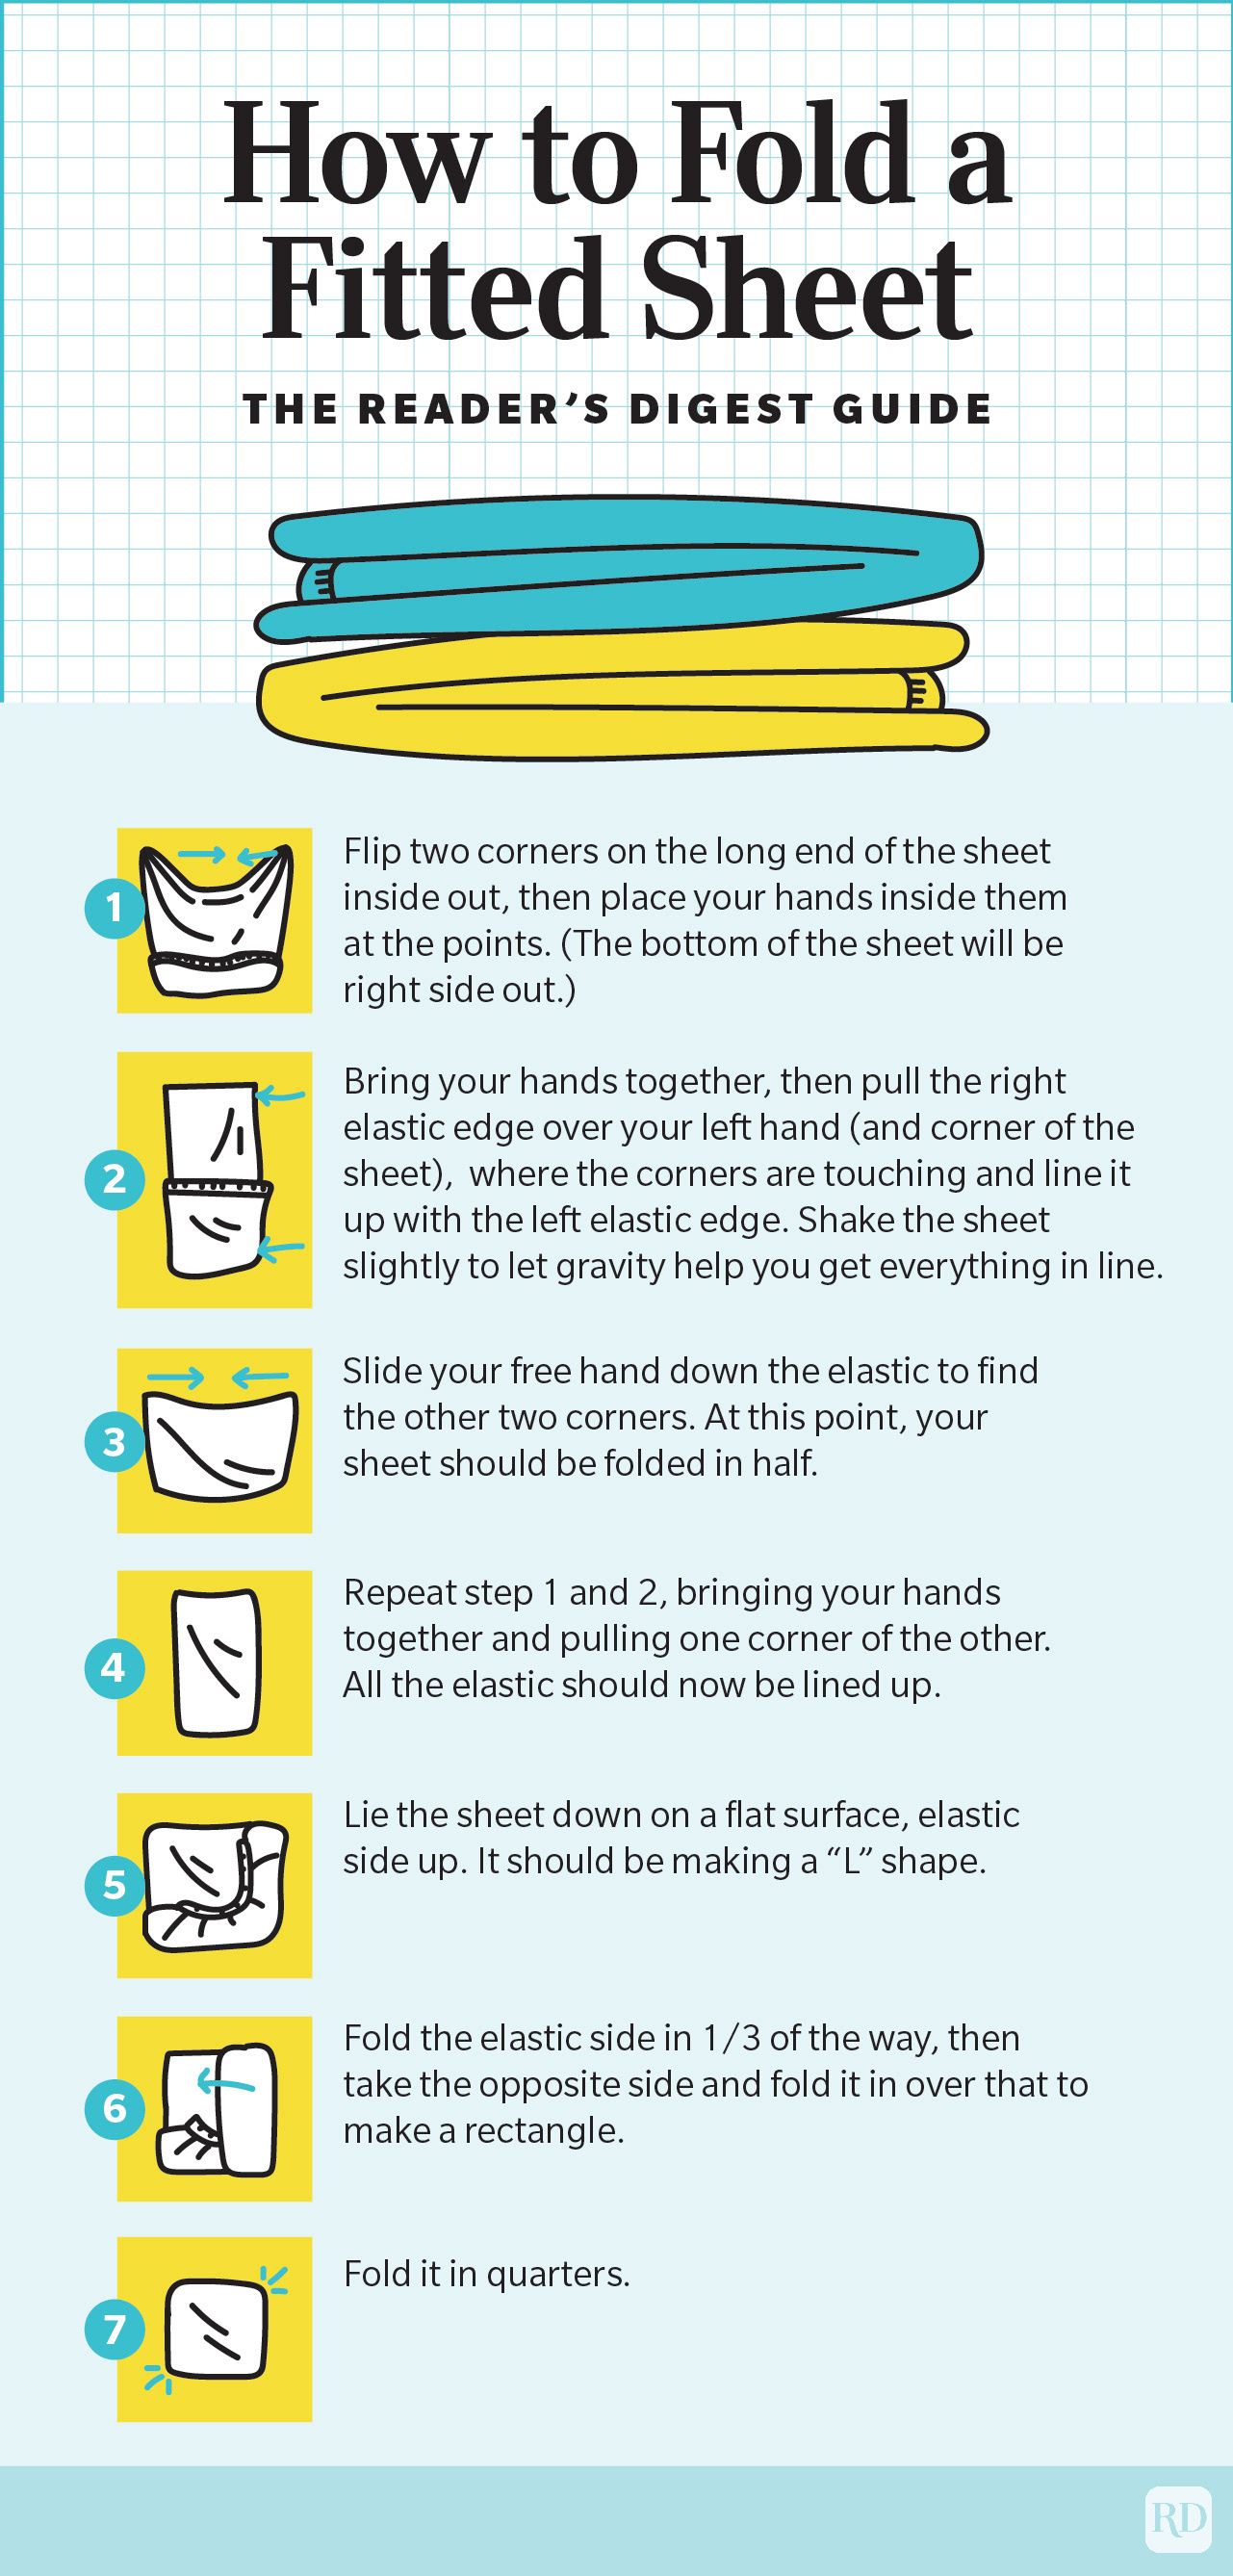
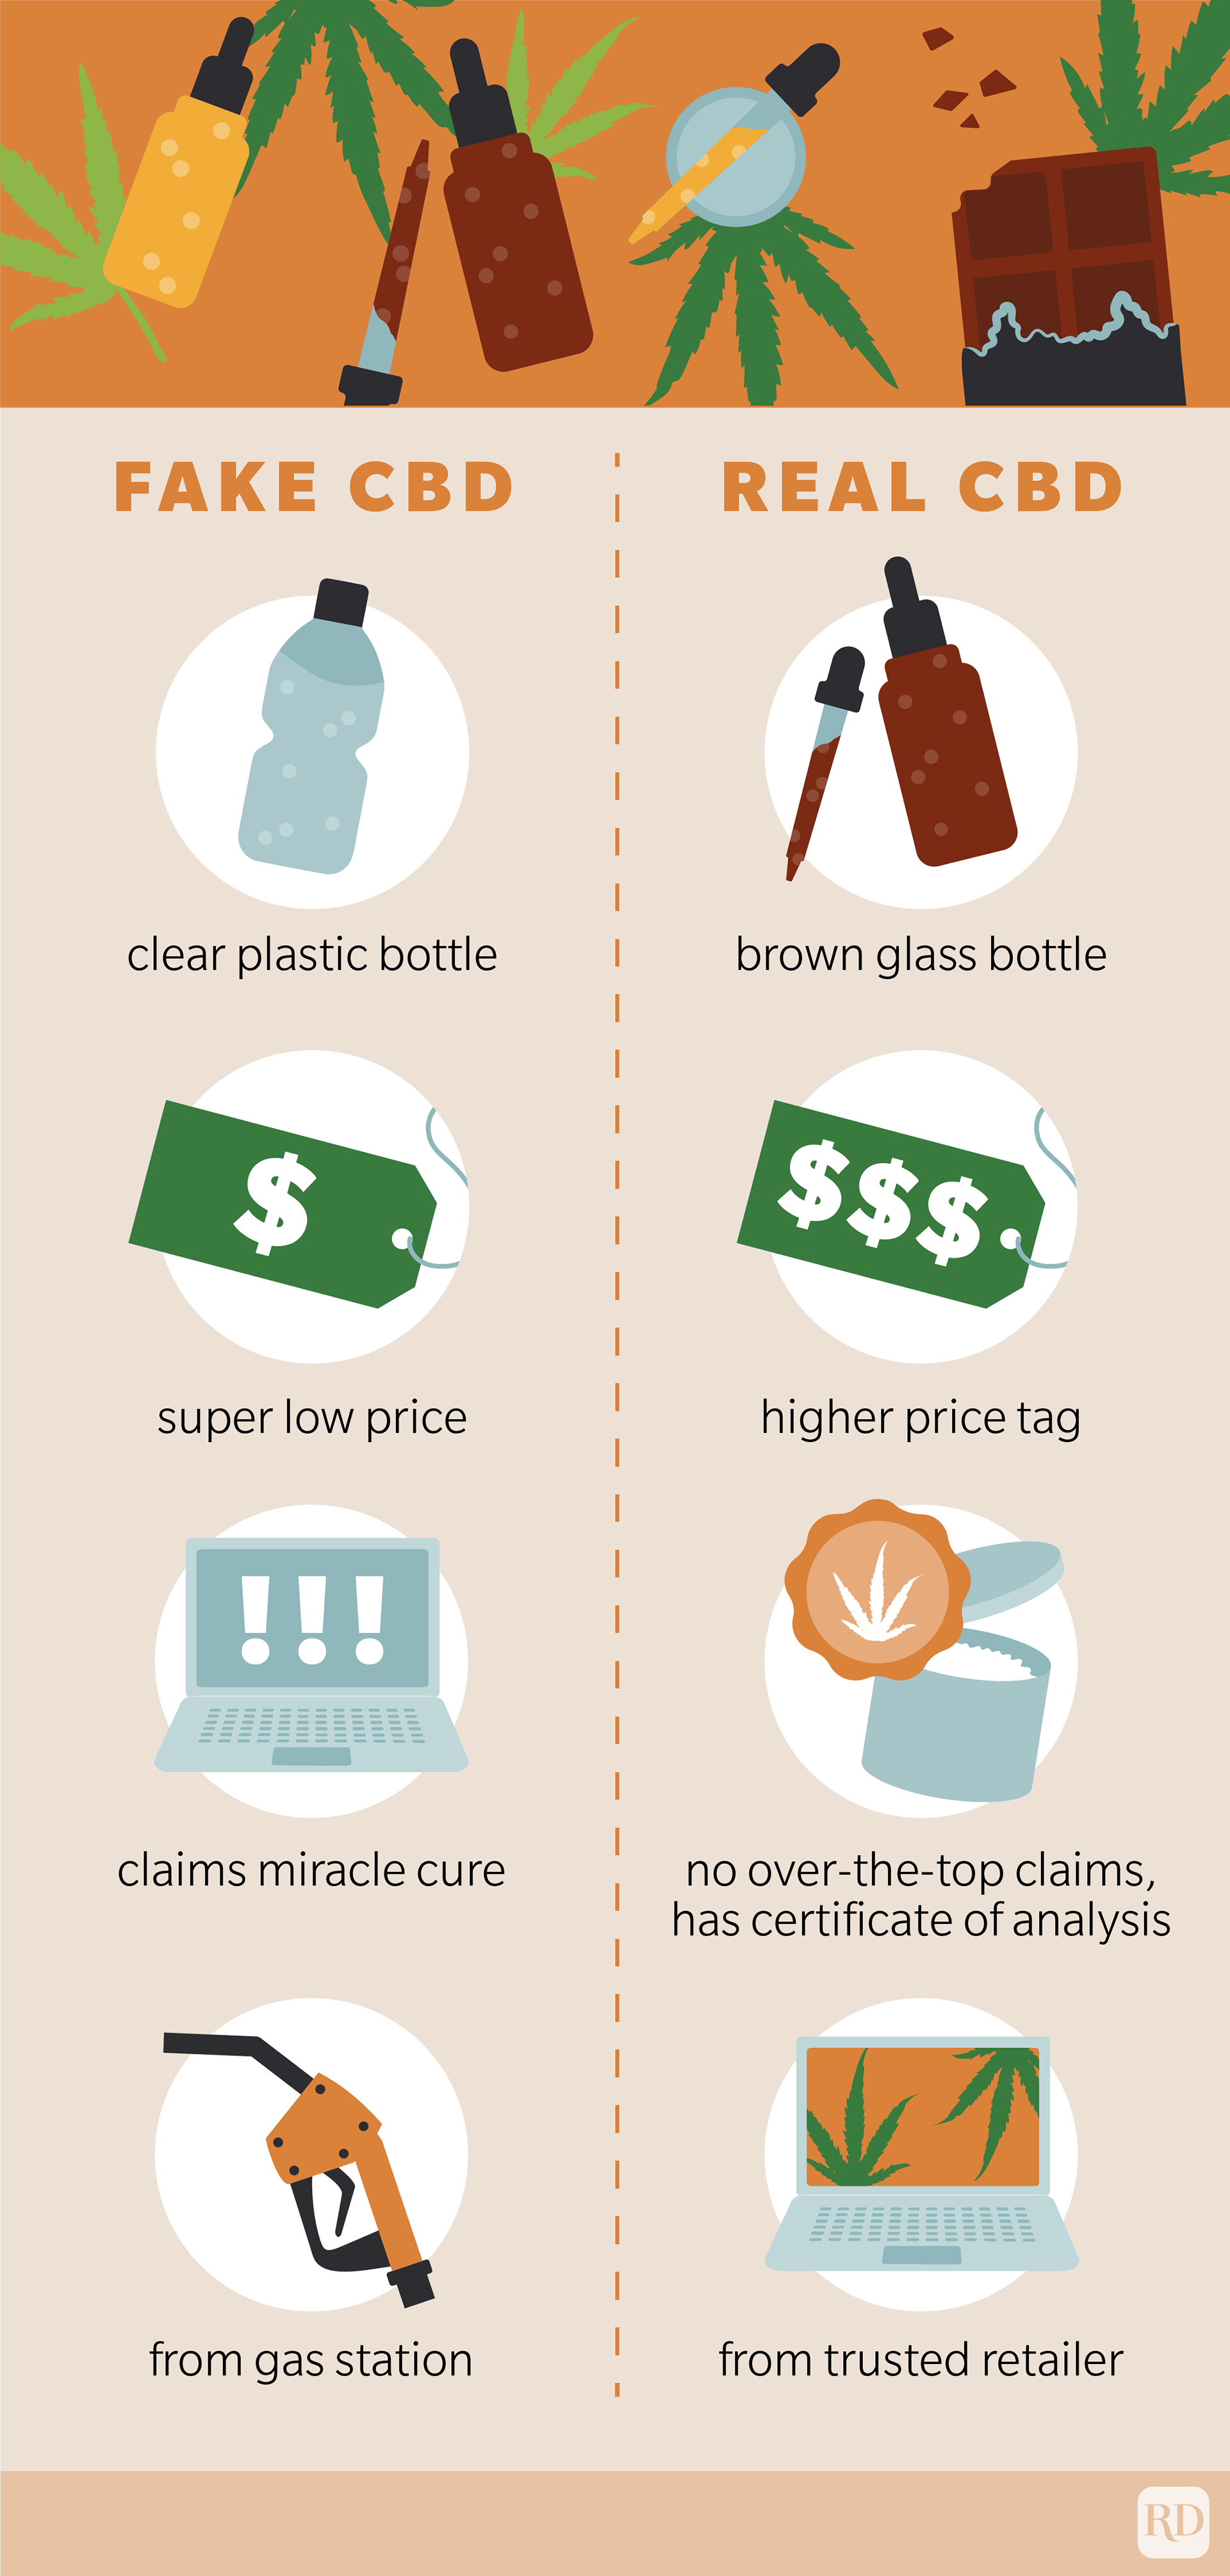
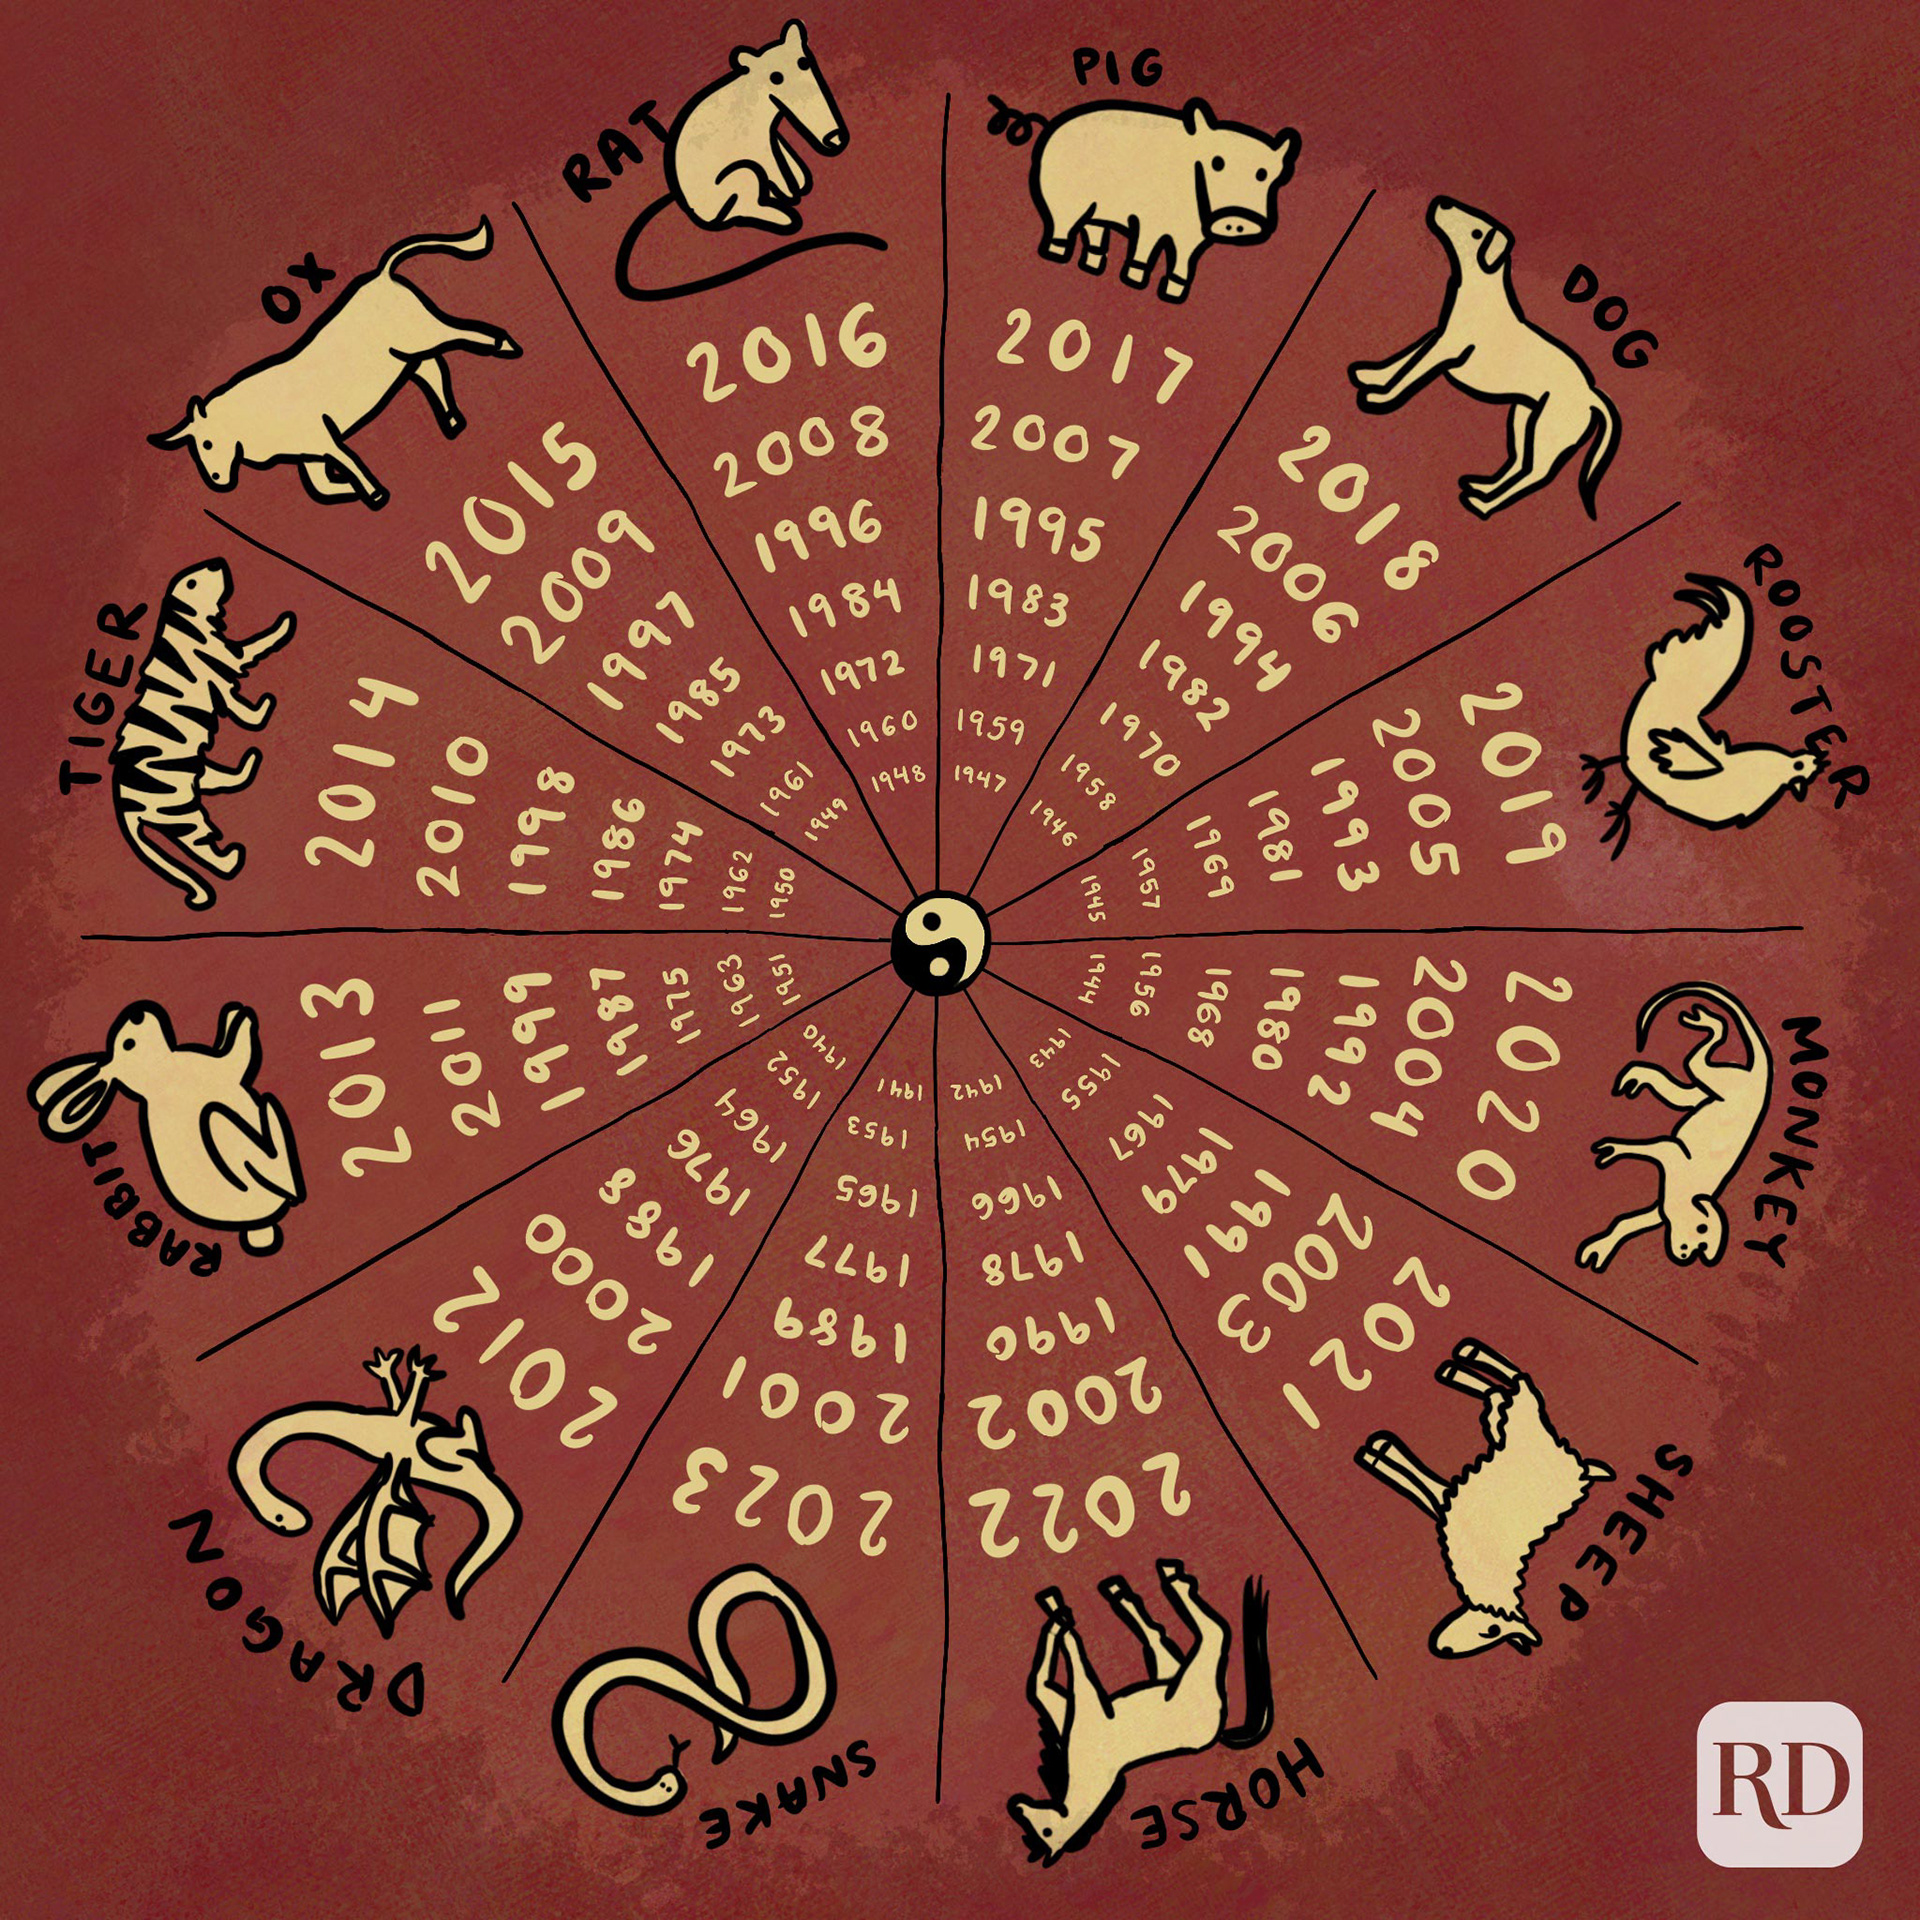
Creating an infographic requires going back and forth with a writer to make sure the text is in digestible, concise chunks. Half of the process is determining which visual format will make the information most quickly understandable, whether that be with a graph, illustration, text box, or combination. Once the general idea was determined, I created the vector illustrations for each of these in Adobe Illustrator, and for the animated ones, added a second step of animation in After Effects. I exported each one in various different file sizes to optimize the view for mobile website visitors, desktop website visitors, and print-out use—as well as audiences on Instagram and Pinterest.
Original Illustrations
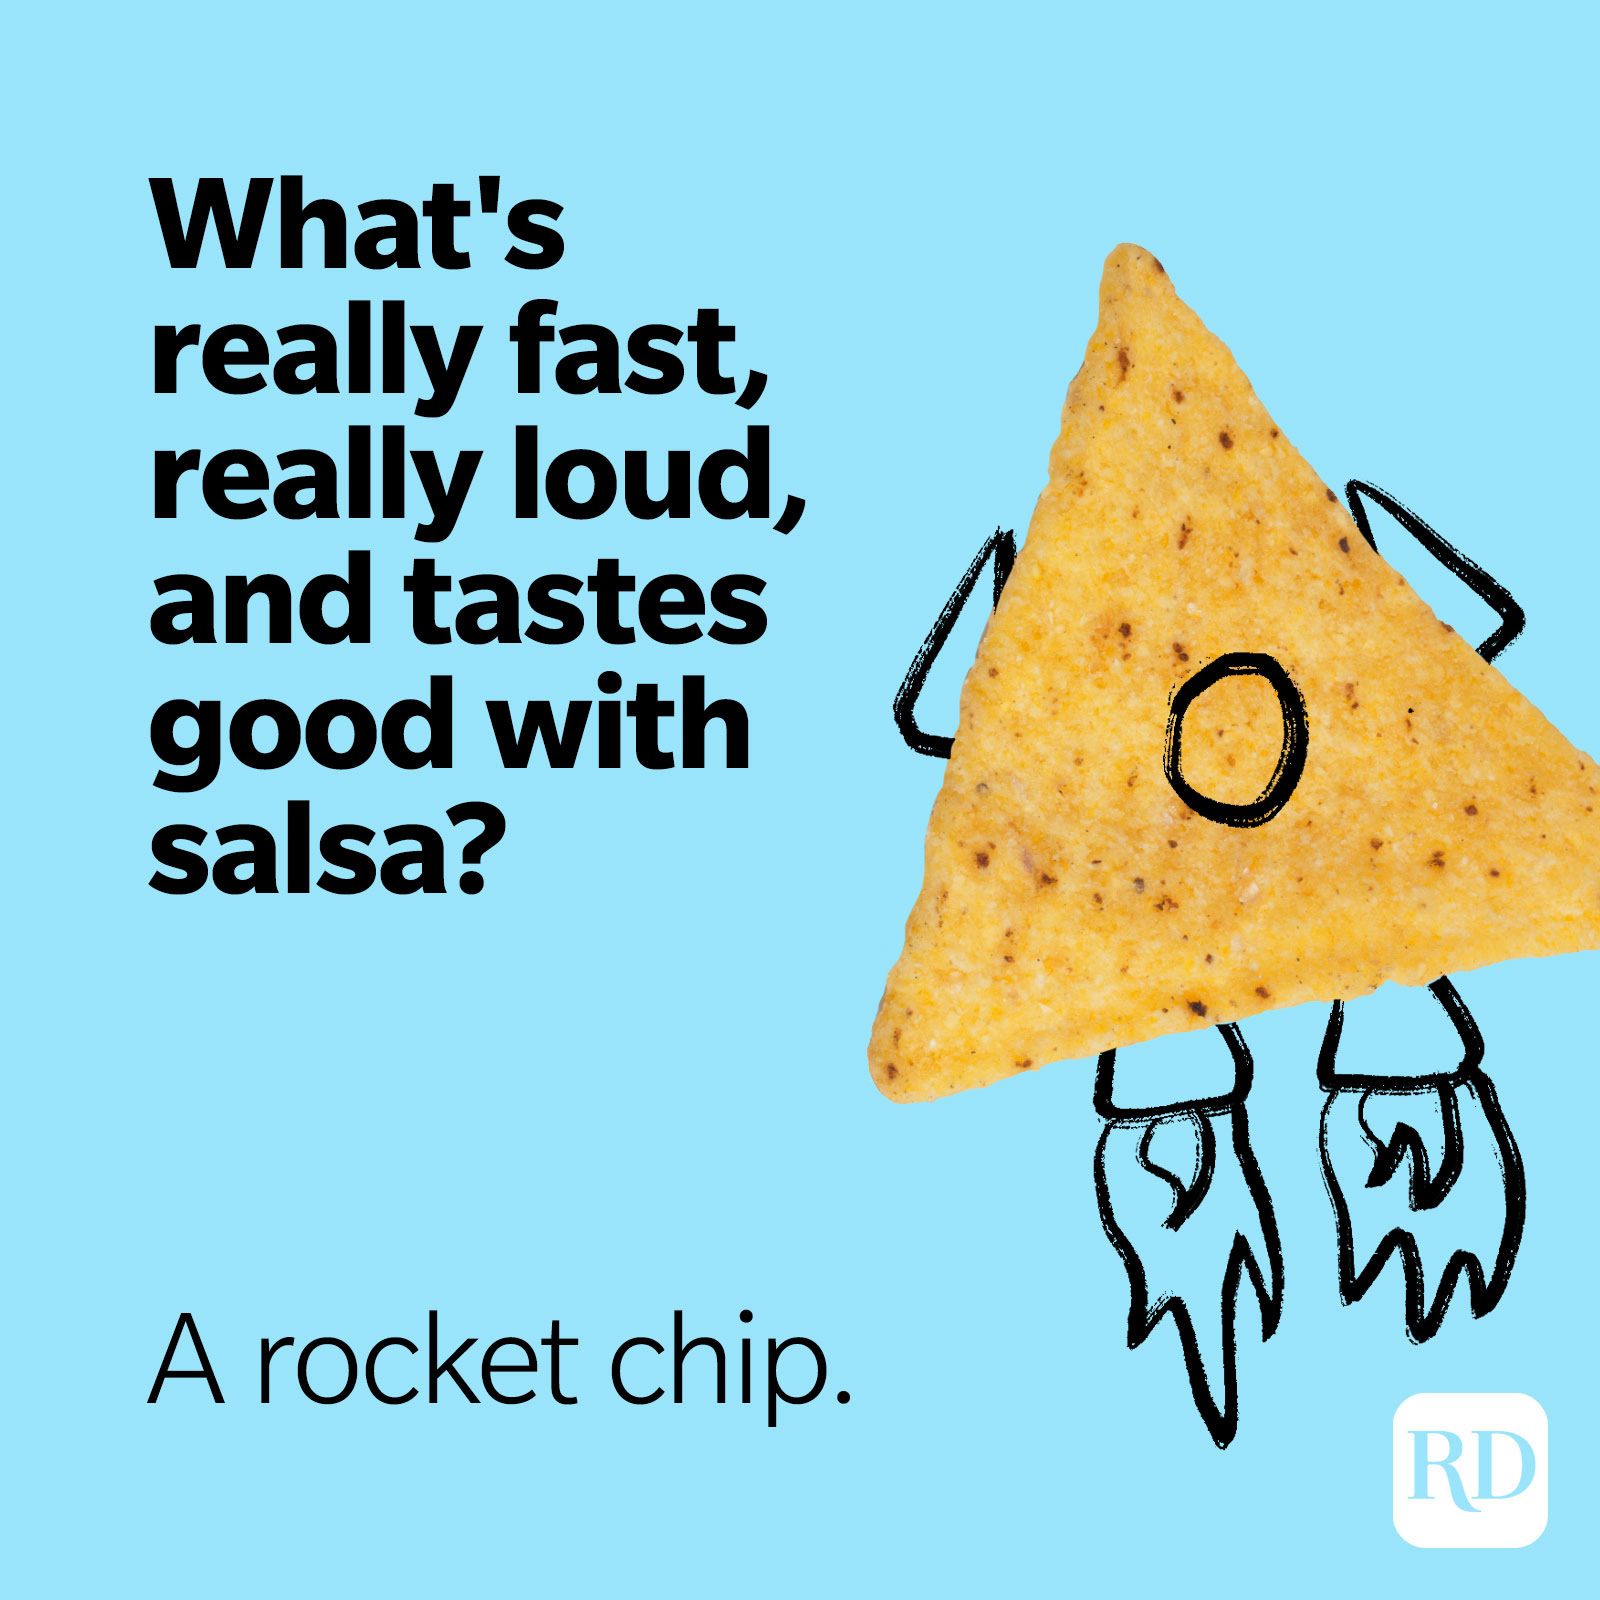
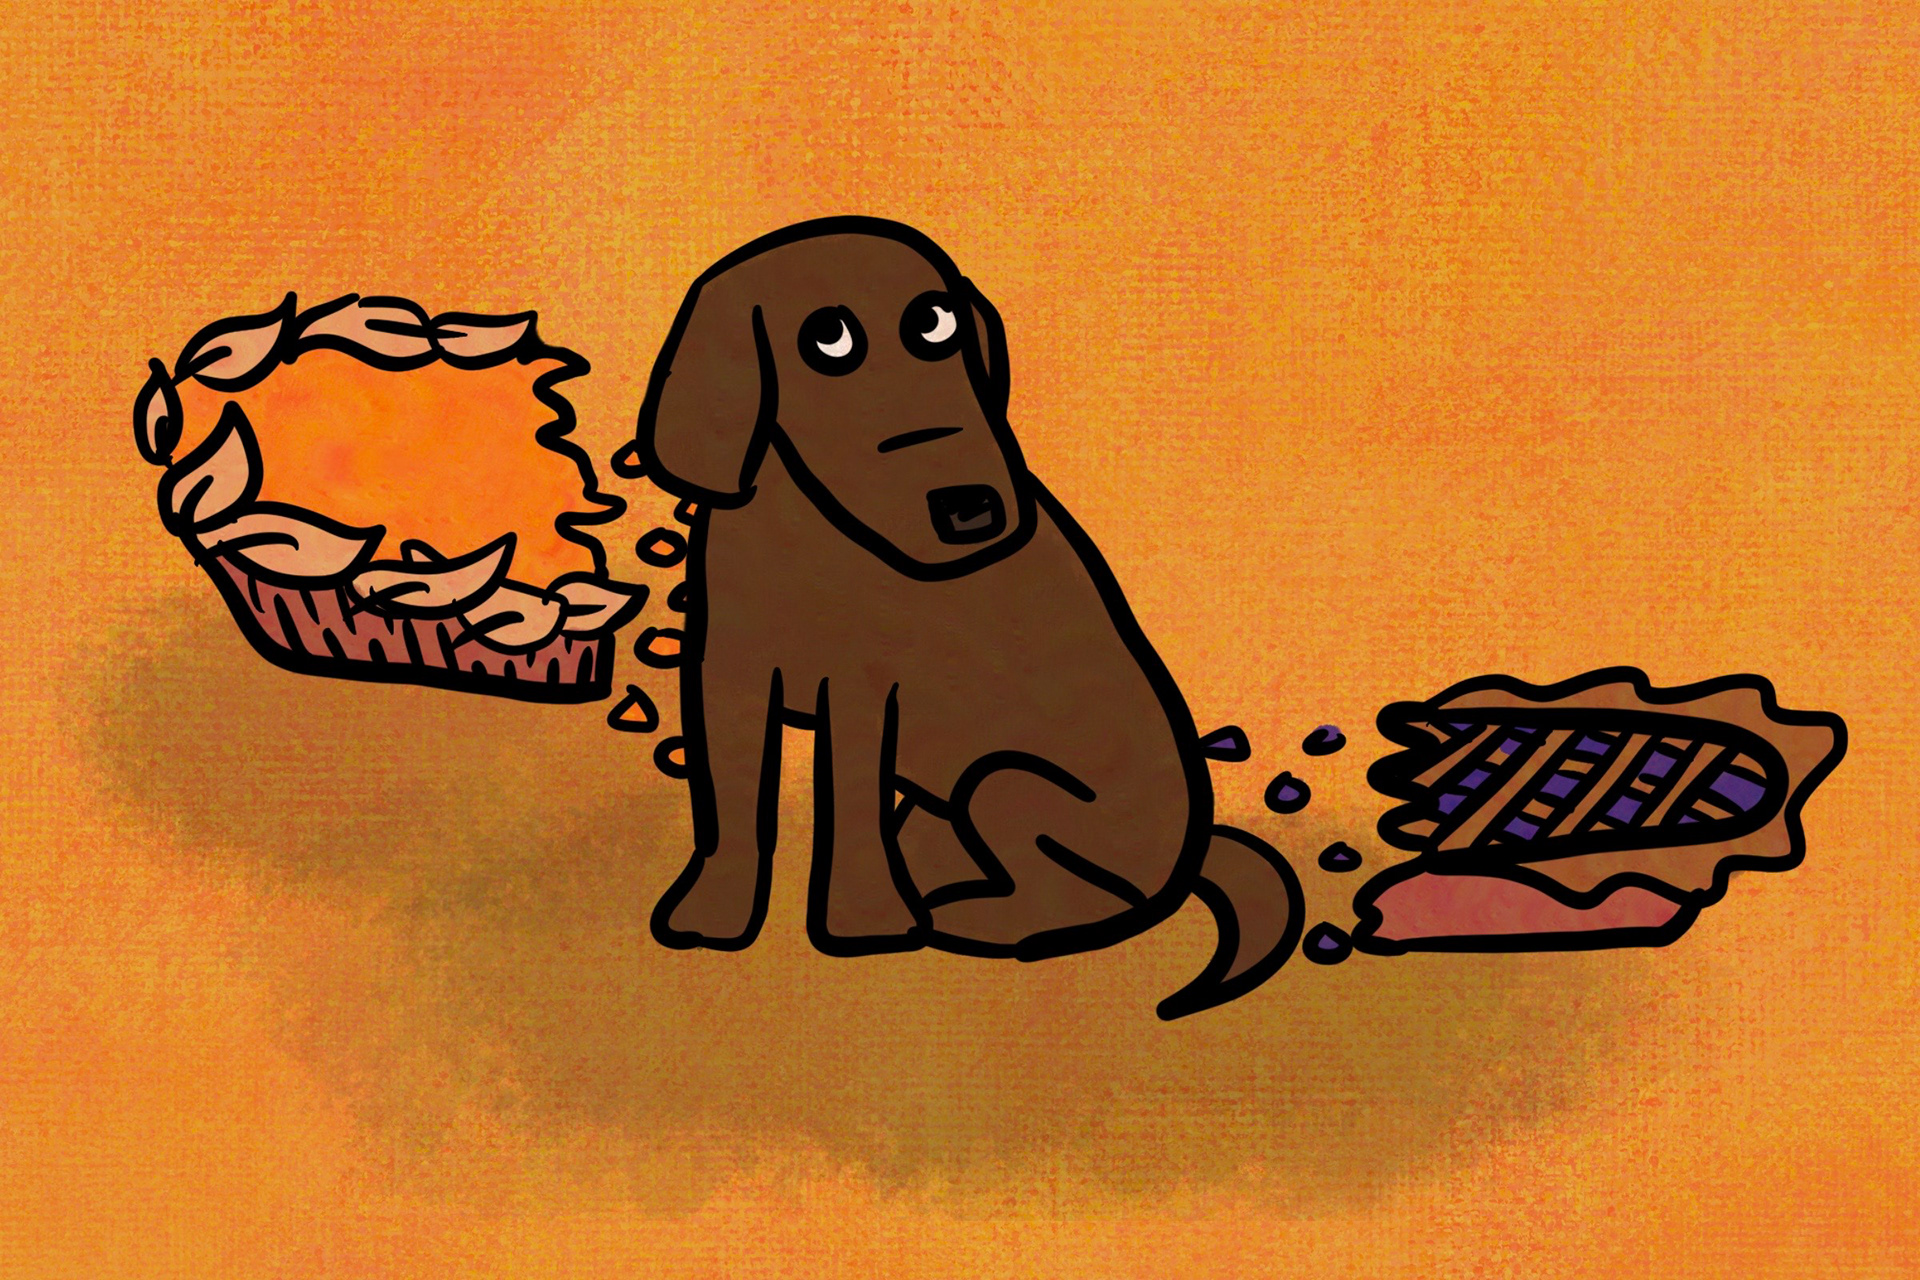
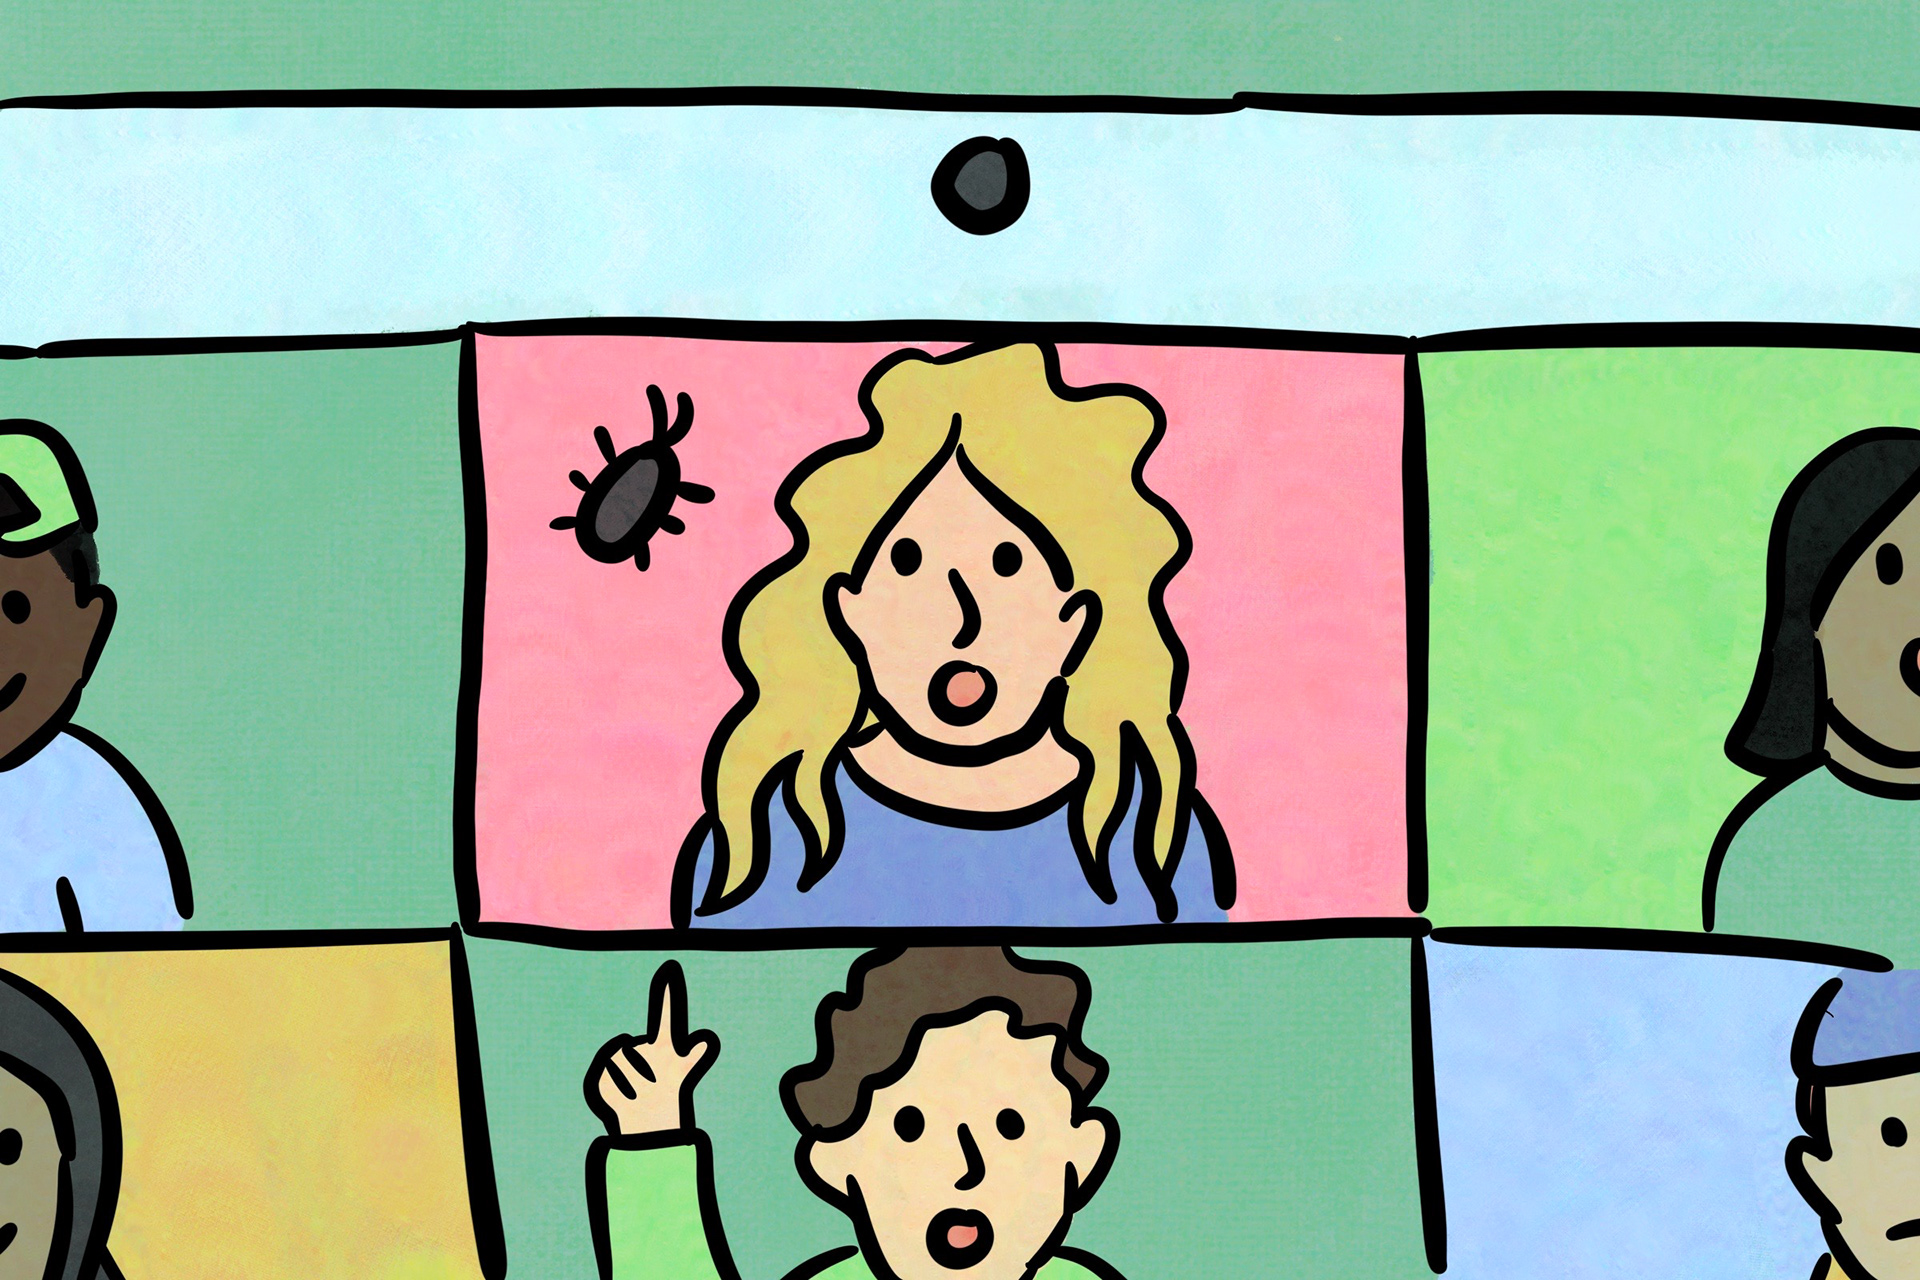
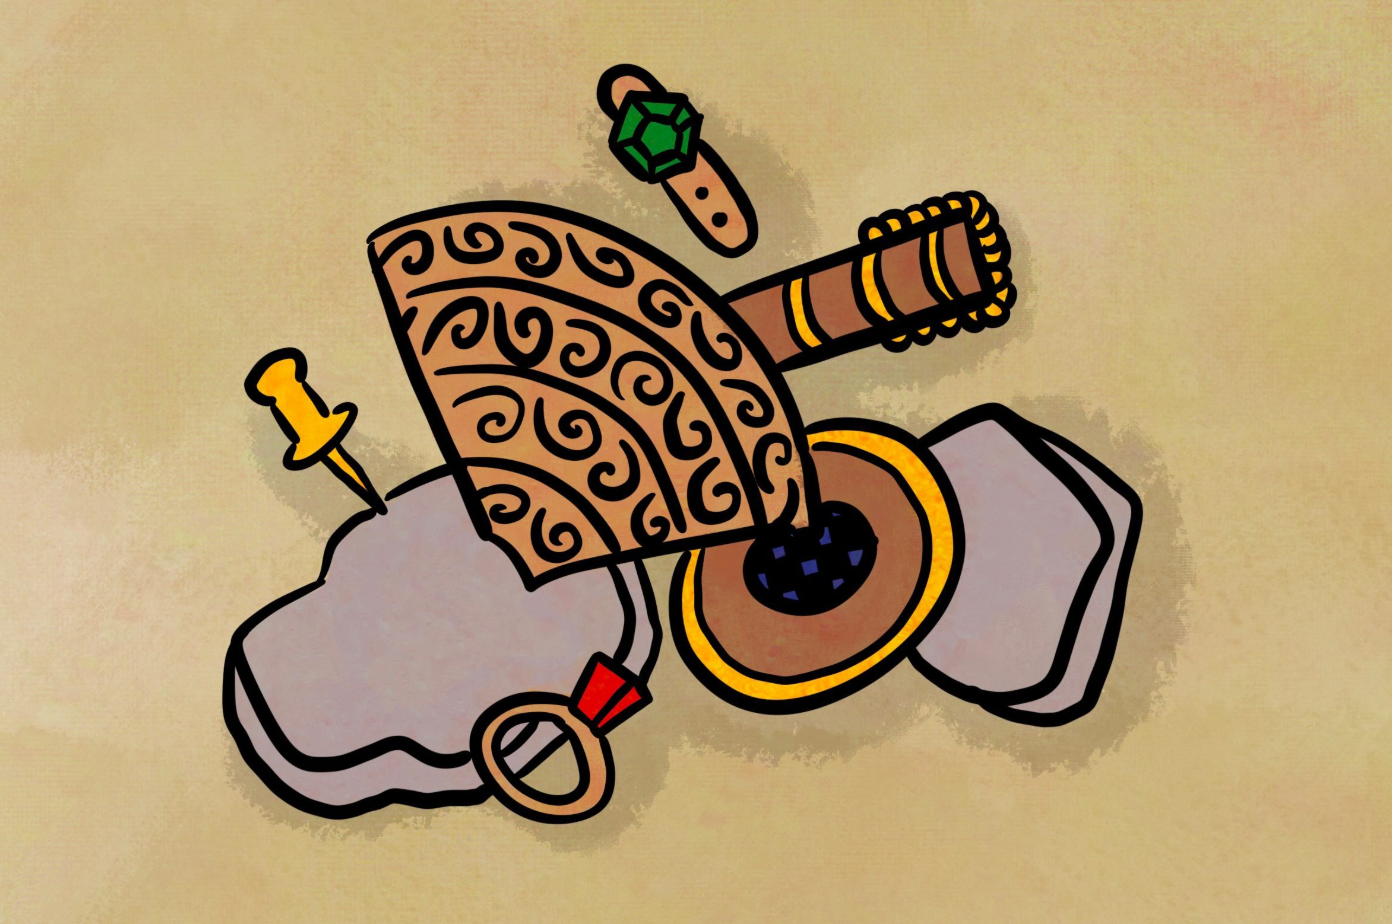
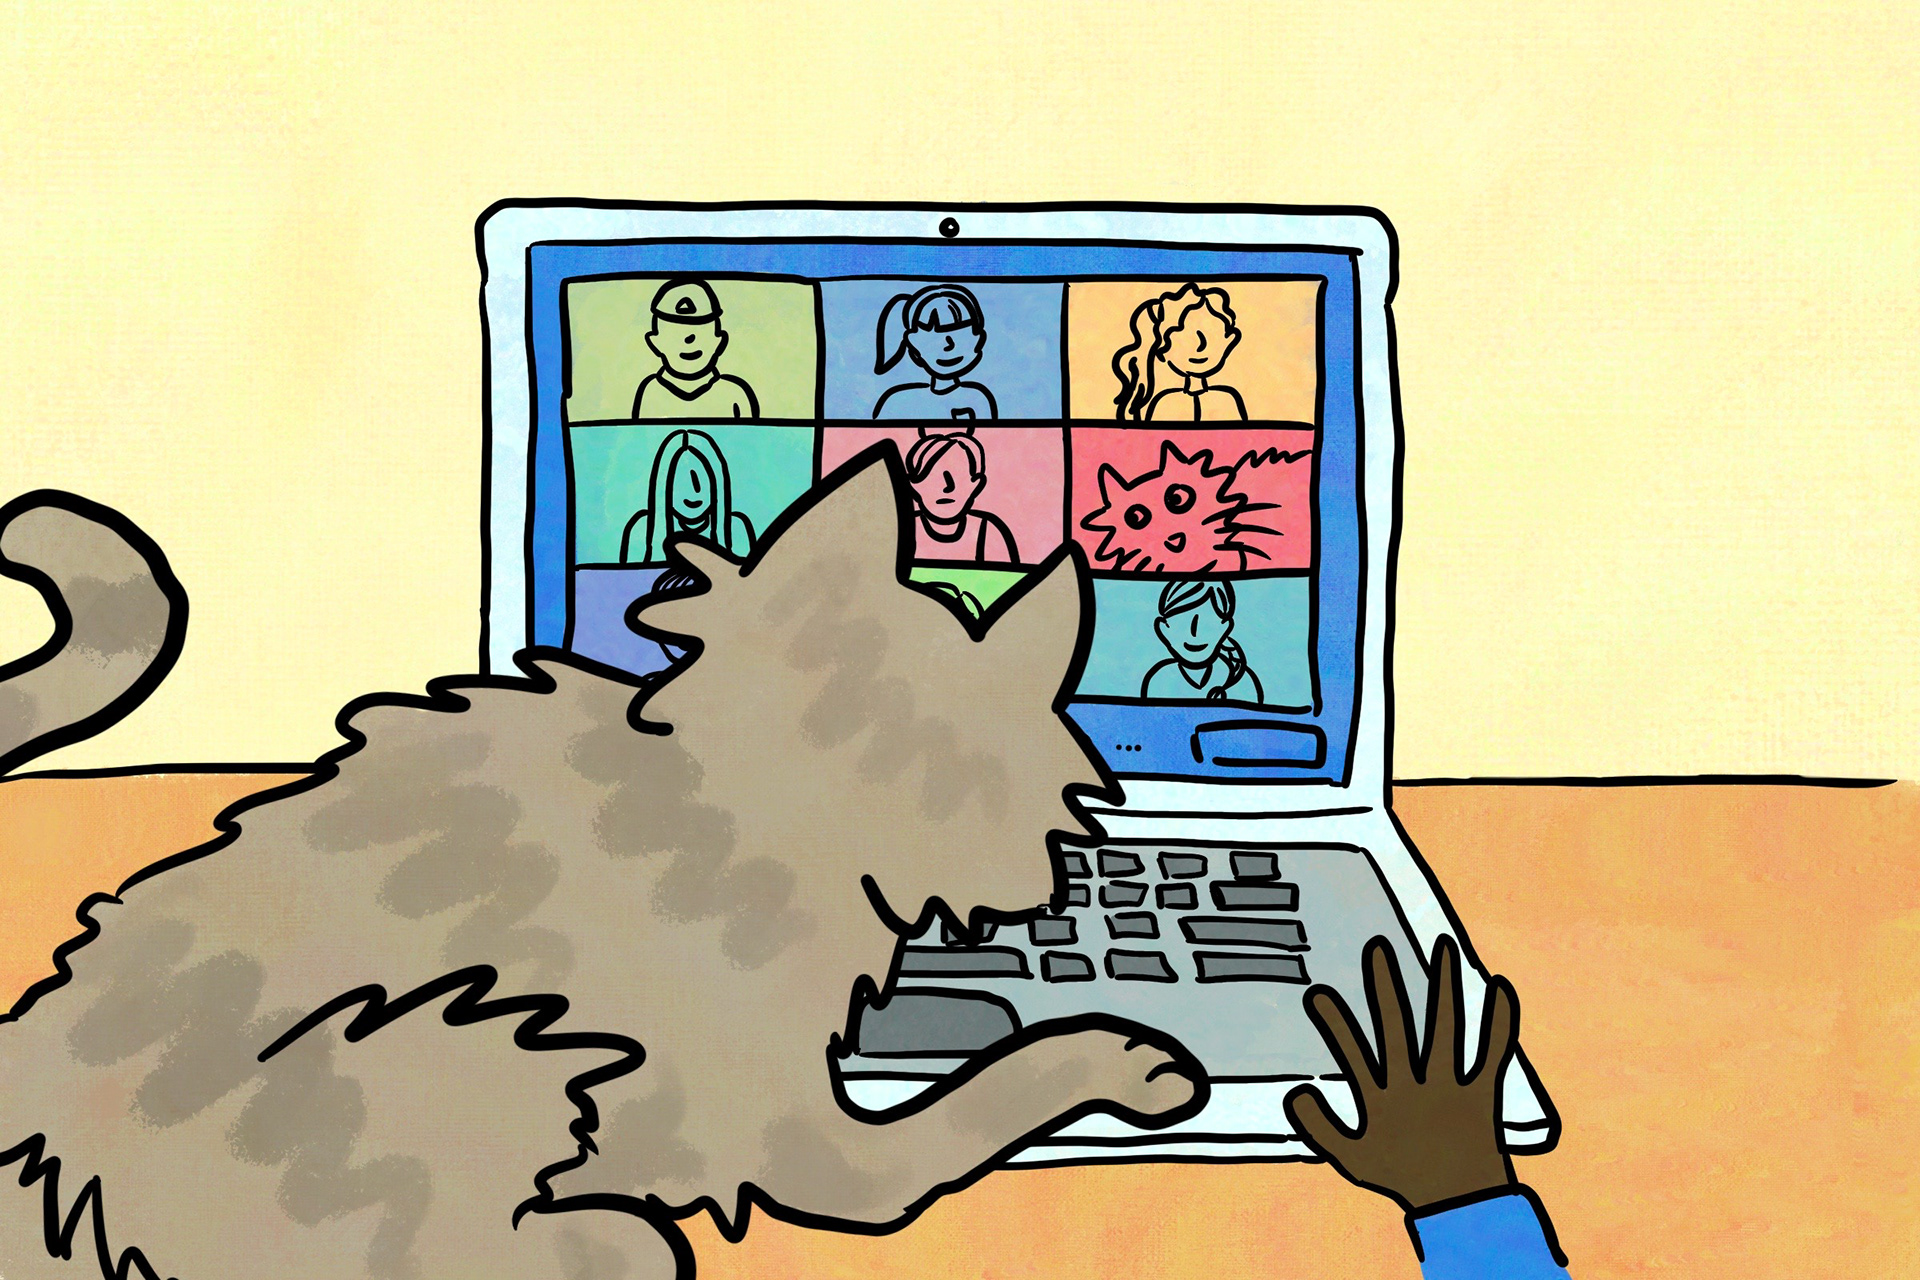
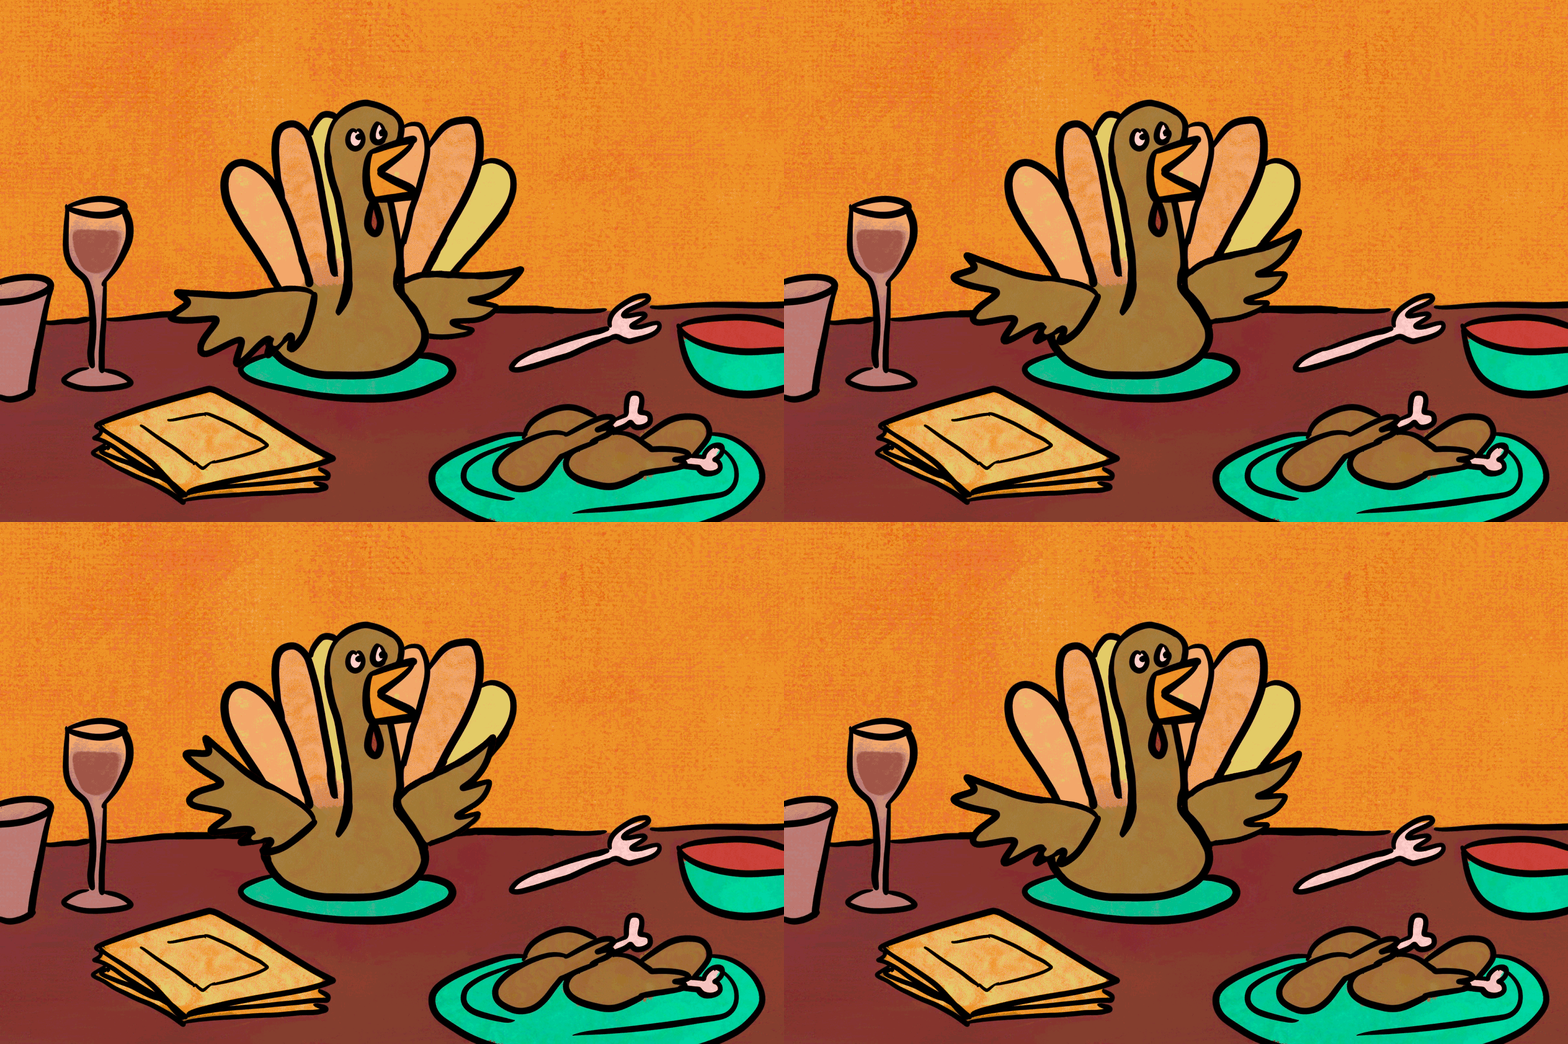
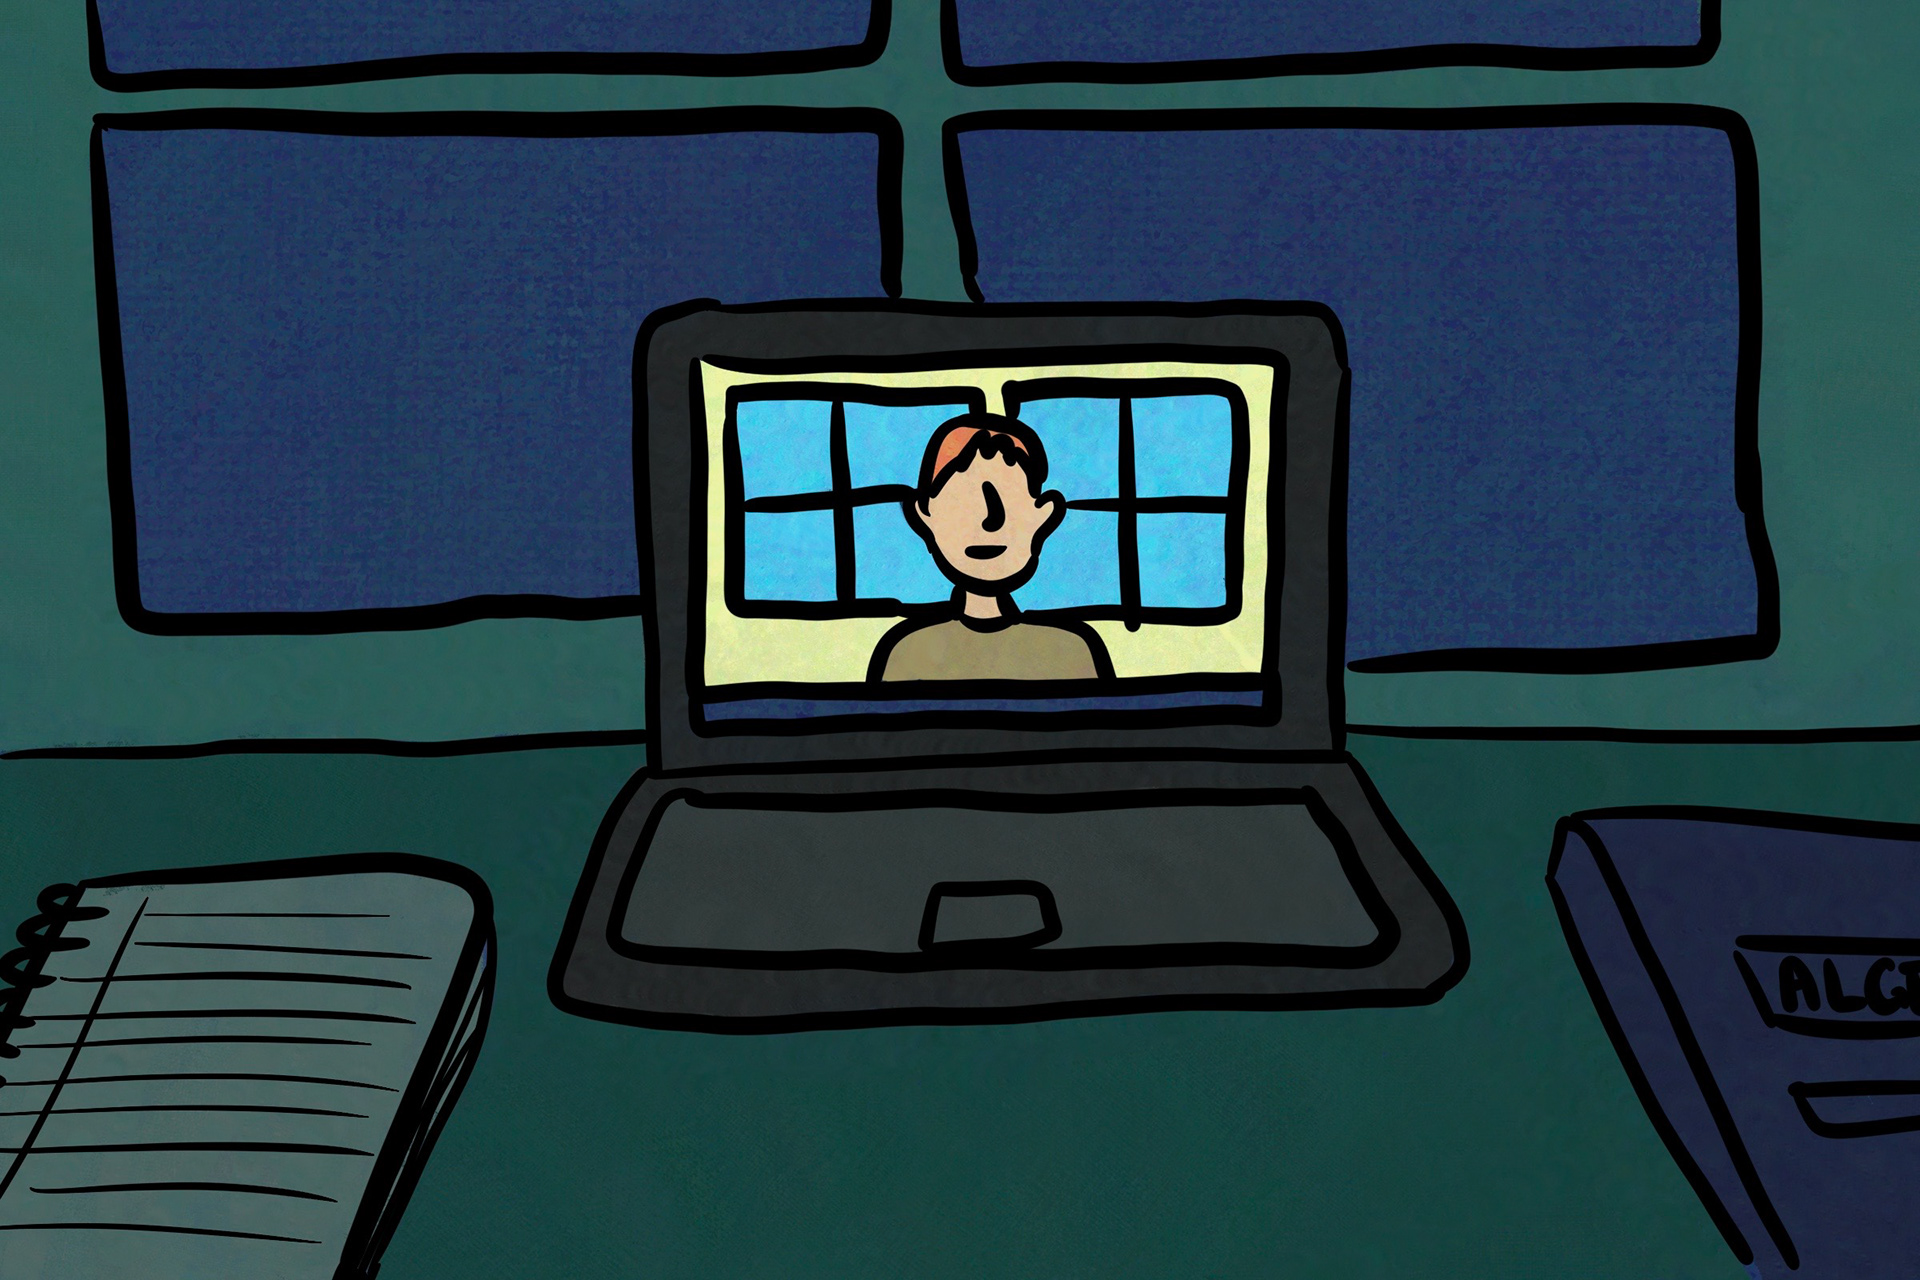
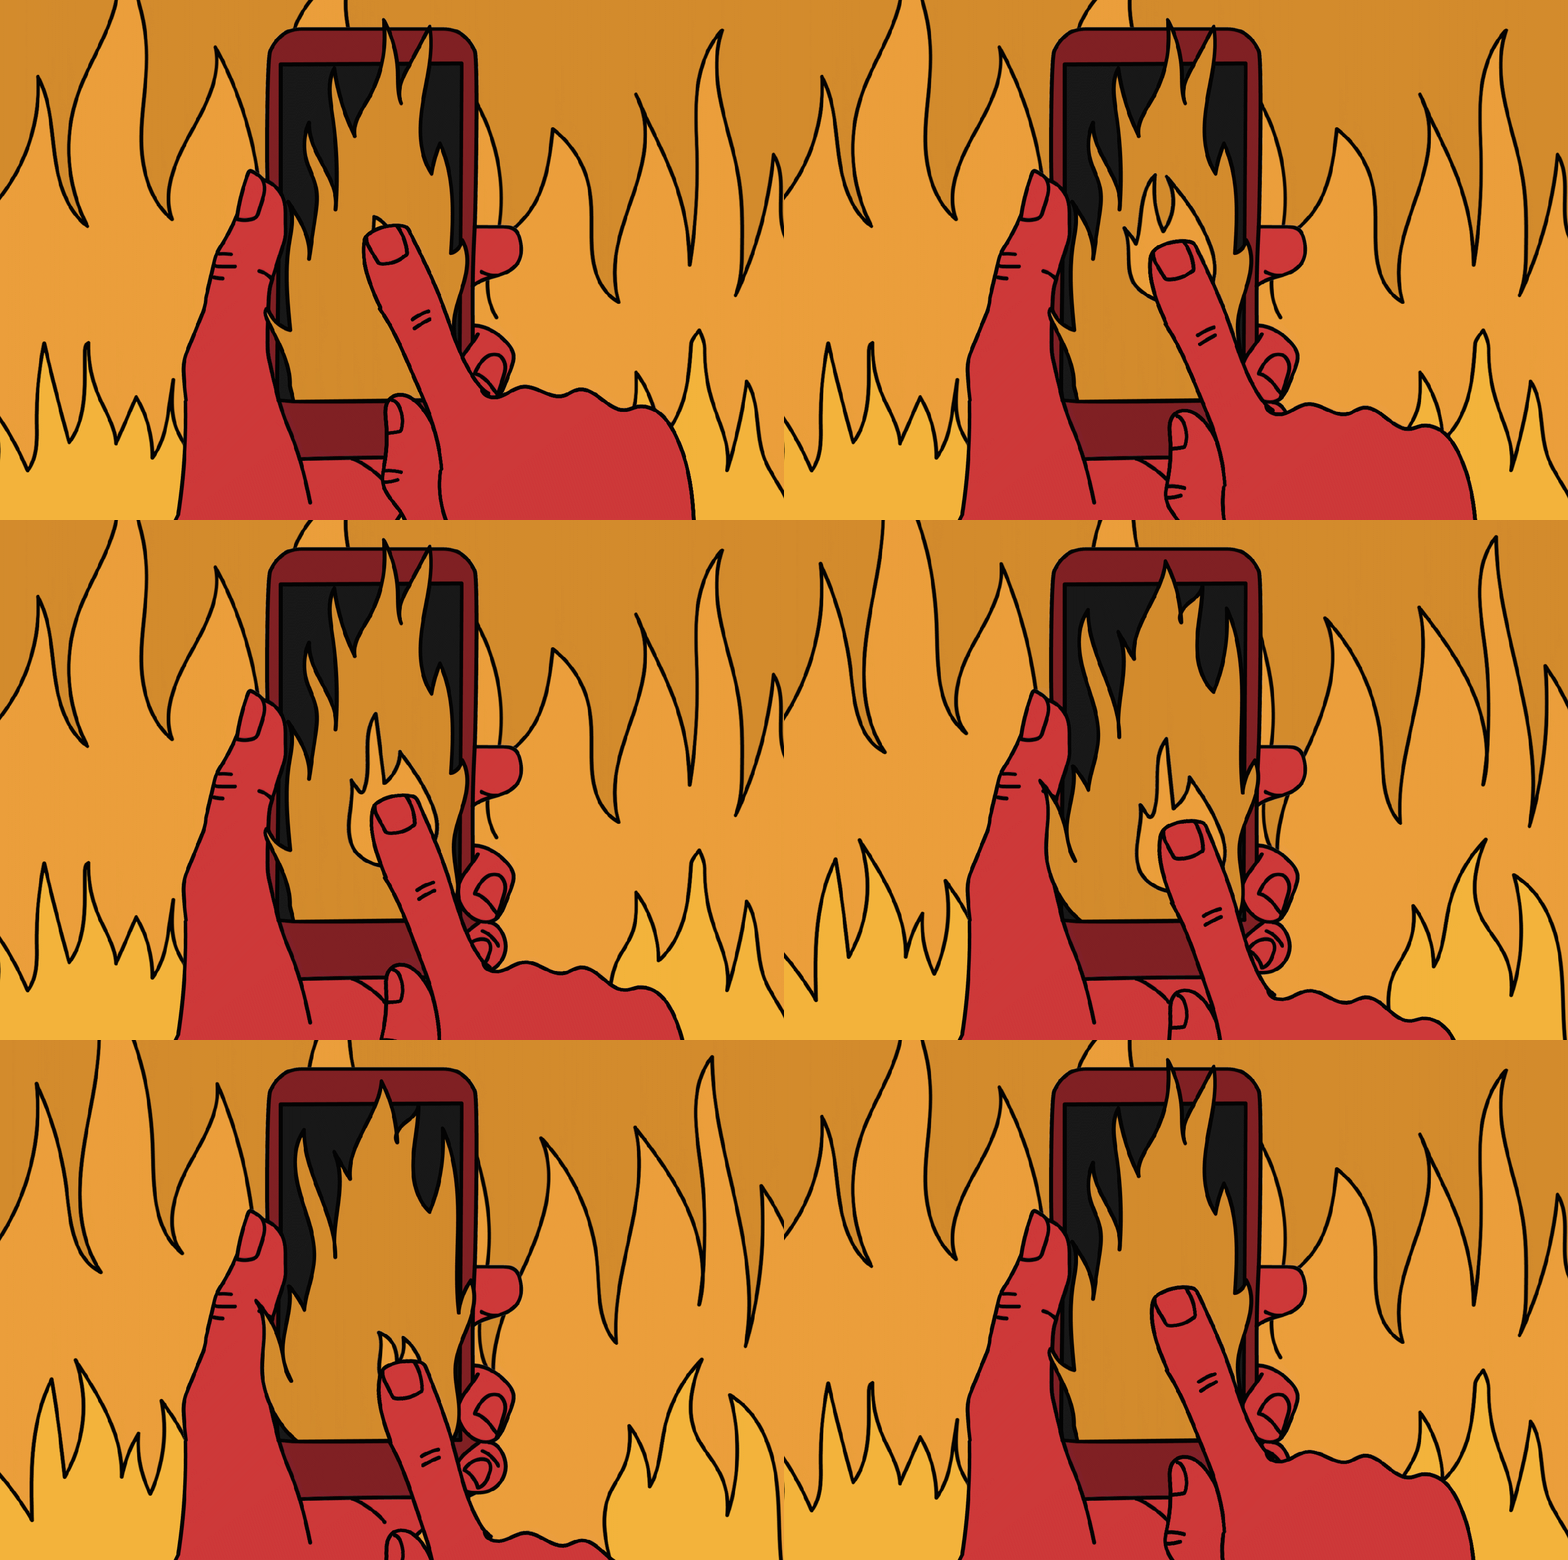
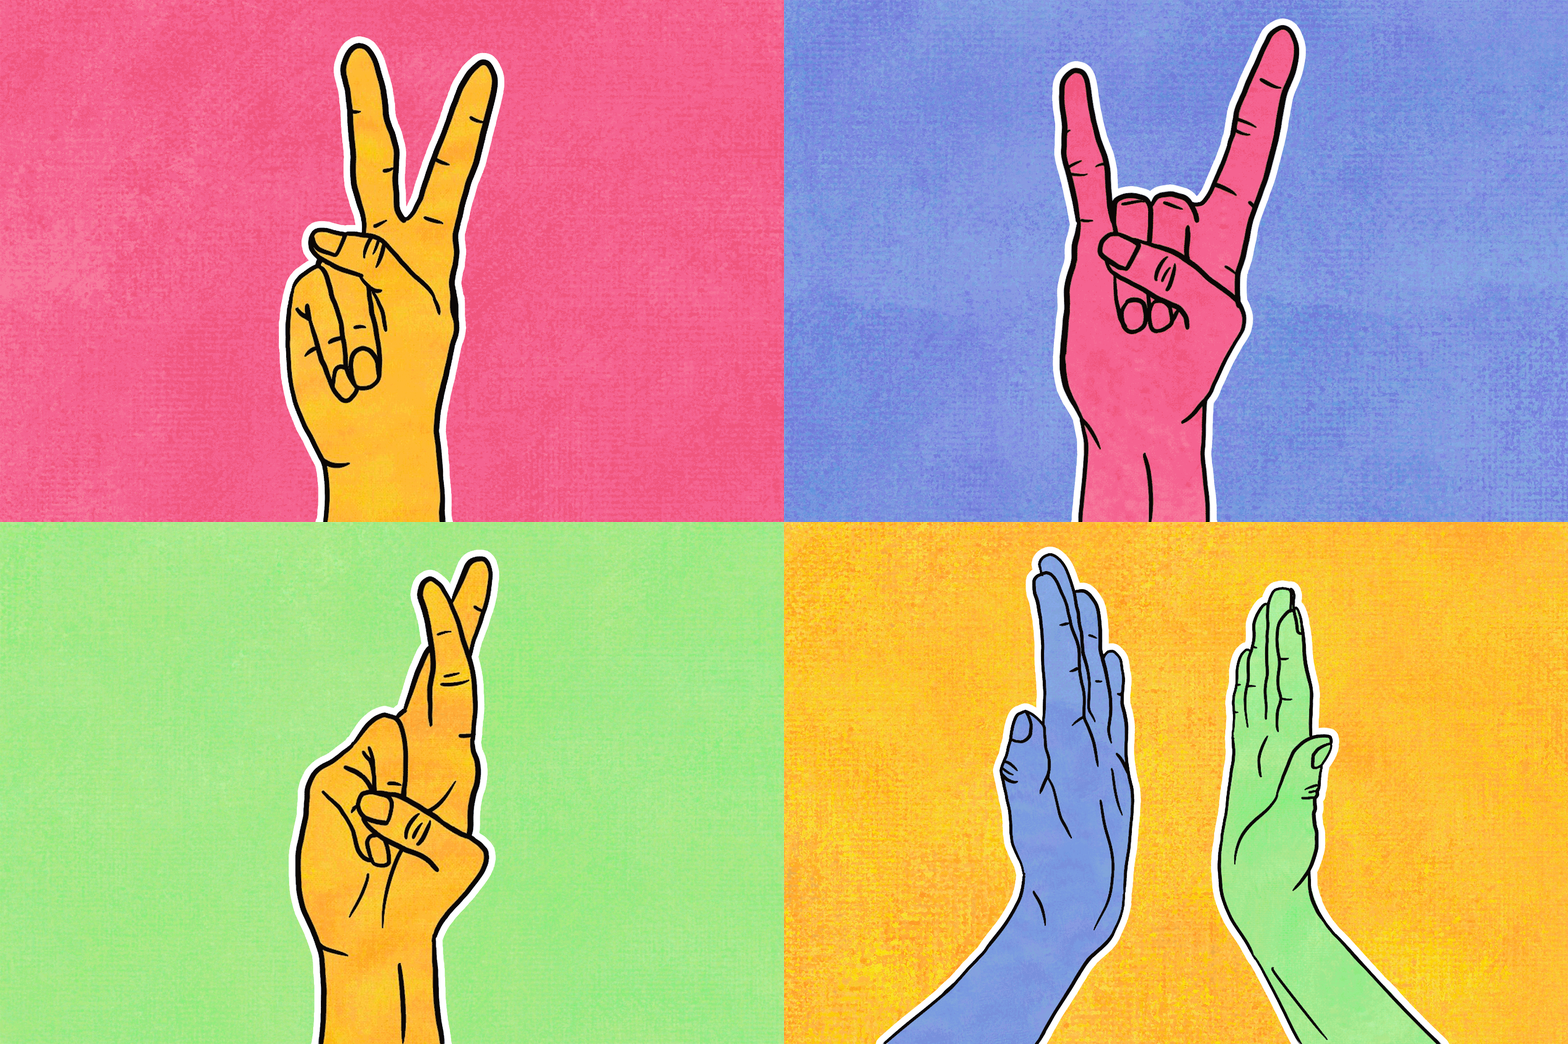
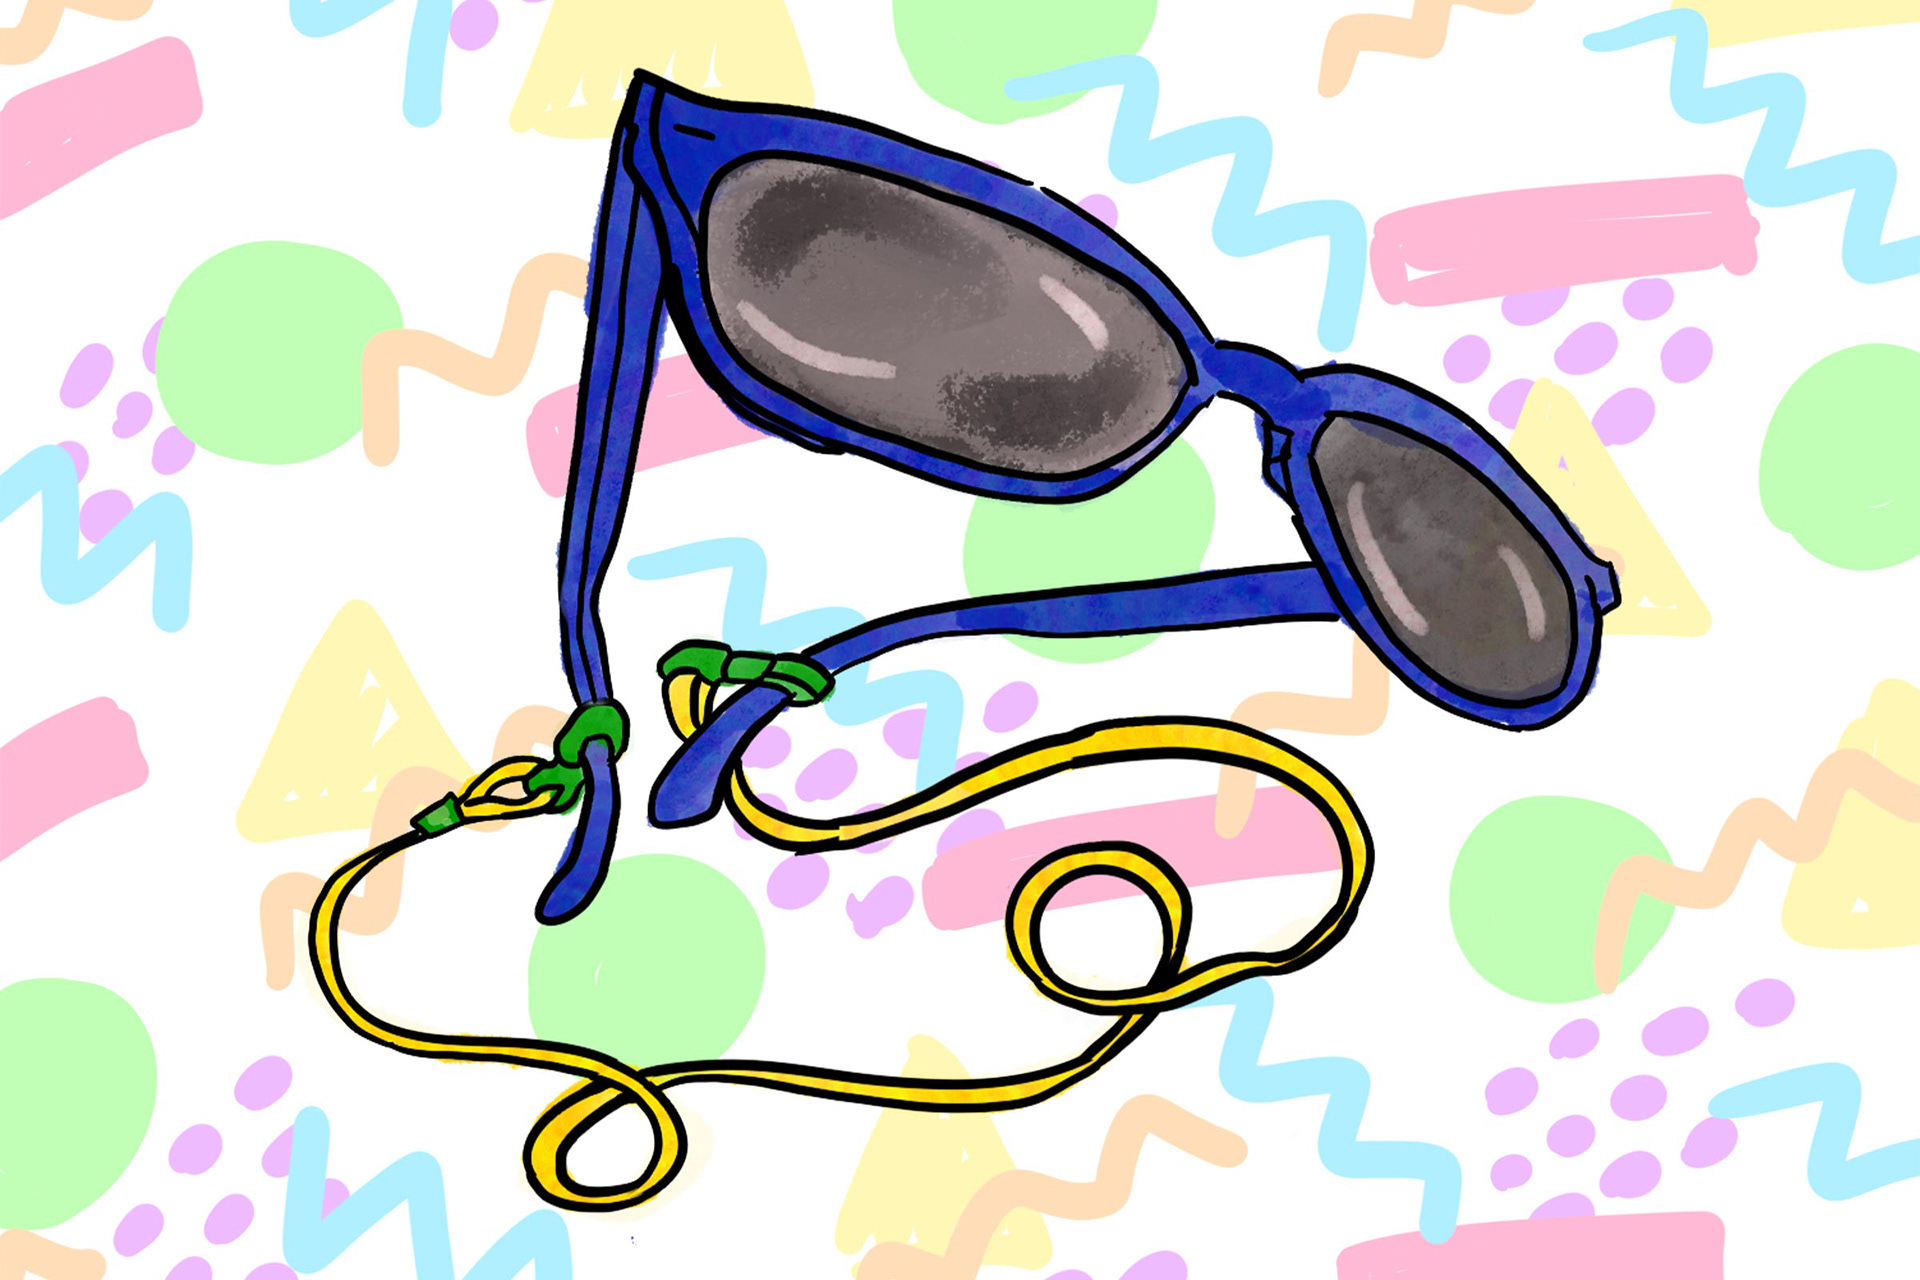
Part of my job was creating original illustrations for digital stories. Most stories contain a featured image that appears first, followed by a series of related images with a correlating color scheme and illustration style. Below are a few of my favorites, pulled from humorous tales of Thanksgiving mishaps, remote workplace faux-pas, and more.
Animated Maps
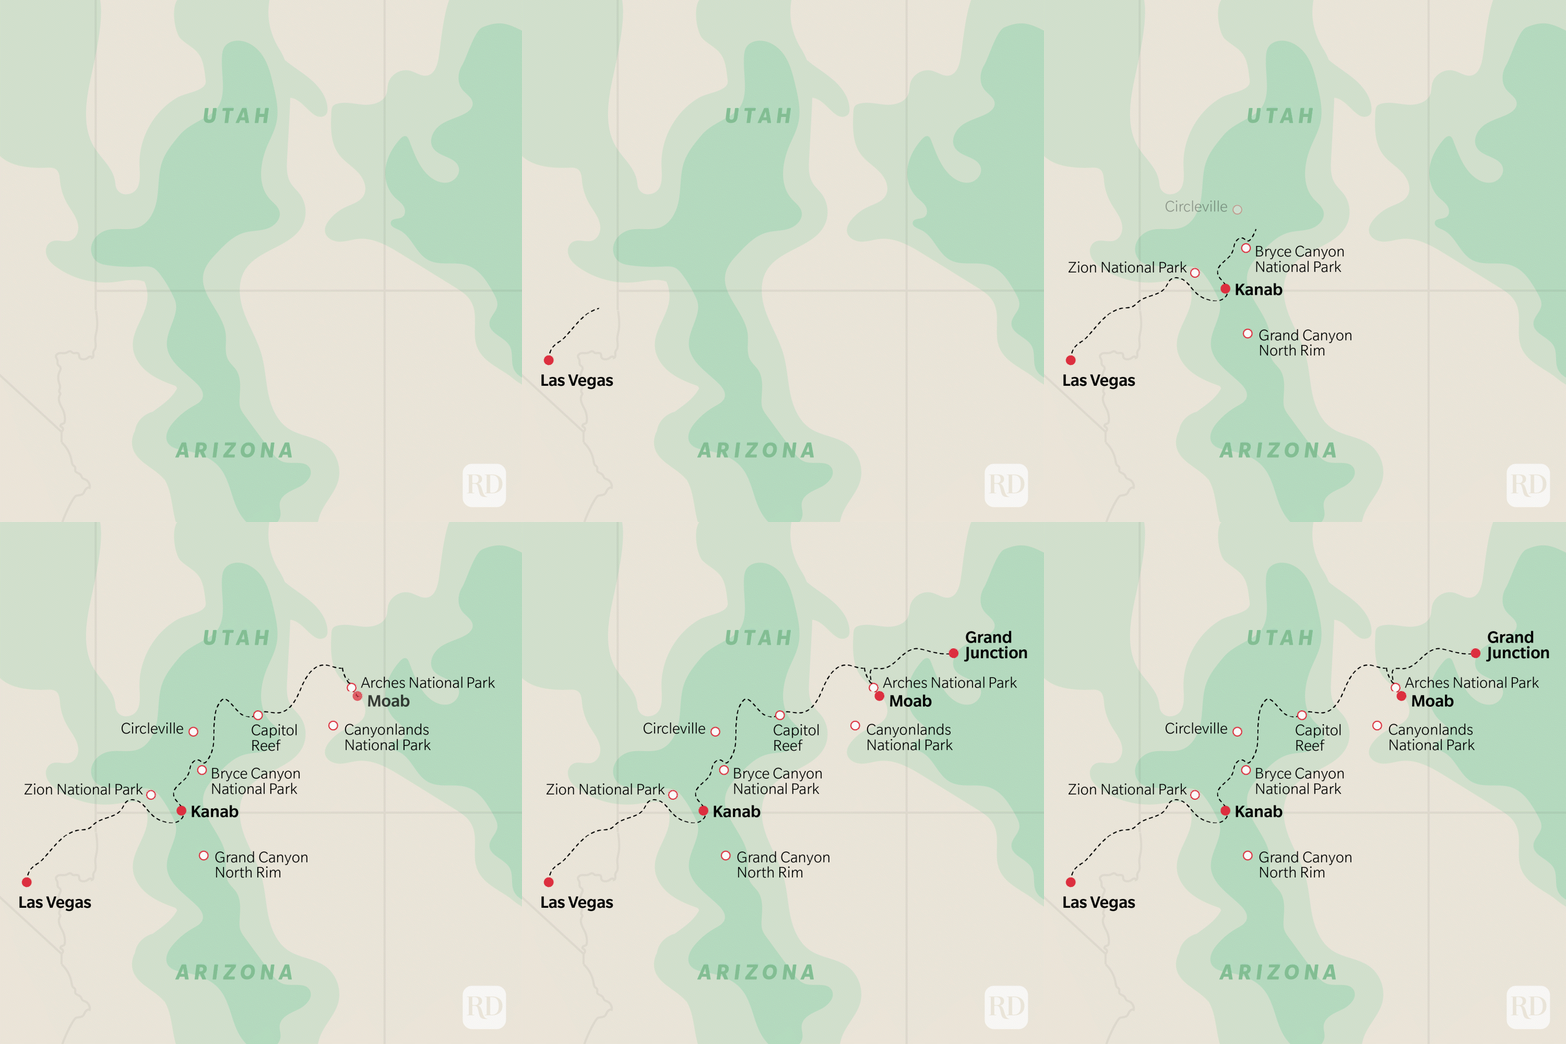
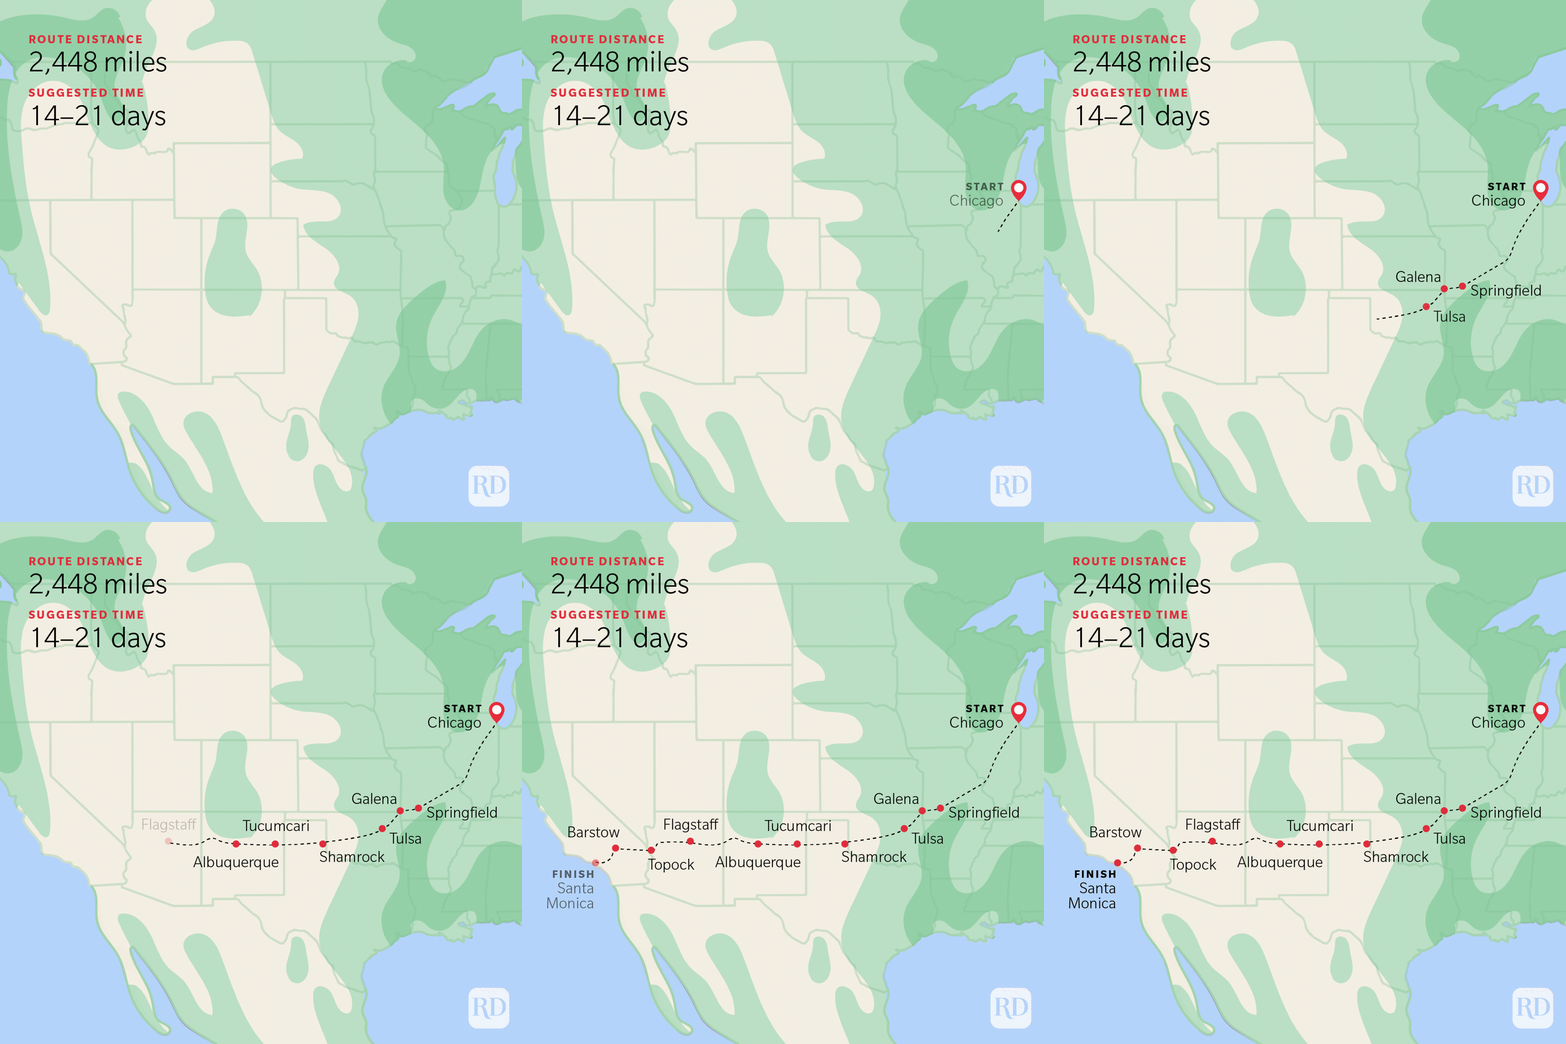
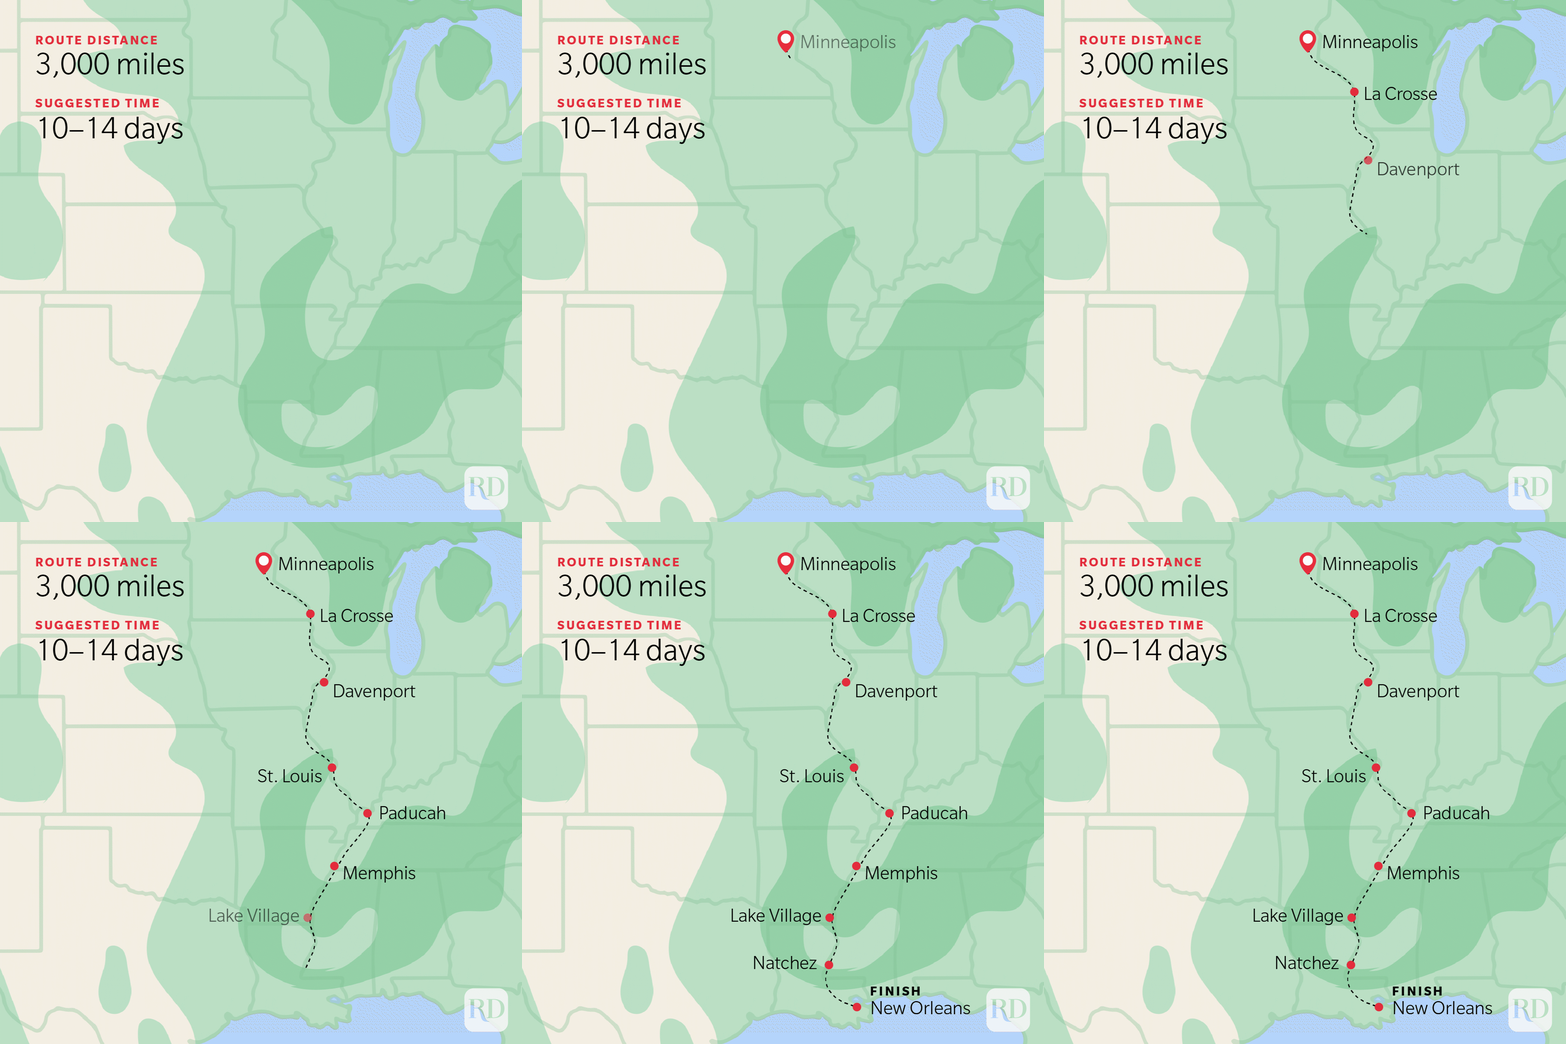
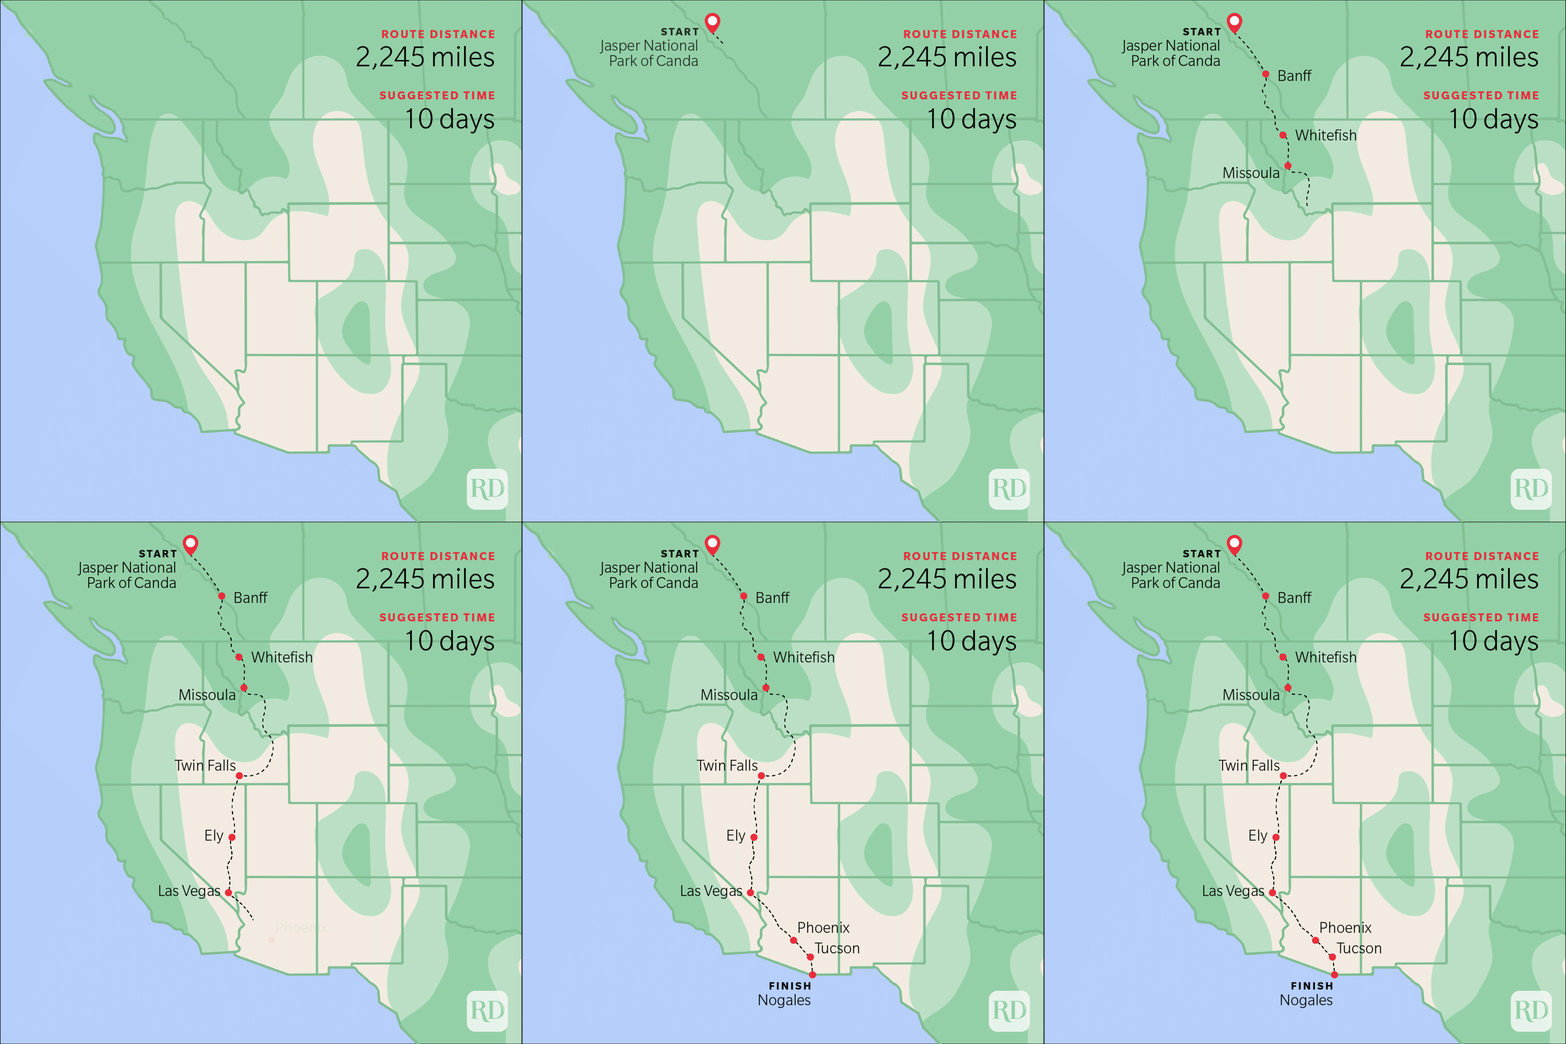
As part of the Best Road Trips in America series, Reader's Digest charted routes to access some of the country's most famous National Parks, landmarks, and cities. To accompany these vivid travel descriptions, I created an animated map for each guide that shows where to drive and where to stop.
